Raw report: enigma_sso_asv_ecology Feeds into: callability-limited-comparative-inference, ecotype-environment-gene-content, environment-embedding-geography, environmental-resistome, functional-marker-validation, gene-cooccurrence-ecological-guilds, multi-omics-integration, study-batch-confounding-of-environmental-associations, subsurface-bacillota-specialization, subsurface-hydrogeological-zonation, taxonomic-resolution-dependent-functional-inference
Overview
This report analyzes sediment and groundwater 16S amplicon sequence variant (ASV) communities from the SSO subsurface site to test spatial structure, hydrogeological zonation, inferred biogeochemical functions, groundwater–sediment differentiation, guild associations, and short-term temporal stability. The central interpretation is that a contamination plume entering from the northeast and moving southwest through the saturated zone structures microbial communities at meter scale, although this plume model remains unconfirmed because direct SSO geochemistry has not yet been loaded. 1
A three-panel synthesis figure in the report overlays this contamination-plume model on the SSO grid, covering inferred redox patterns, processes and the plume corridor. 1
Key Findings
Spatial structure and the U3–M6–L7 corridor
Across 9 wells arranged in a 3×3 grid spanning approximately 6 m, the sediment dataset contained 23,458 ASVs and 37 sediment core samples aggregated per well; the well-aggregated sediment ASV abundance matrix (data/community_matrix_sediment_asv.csv) has dimensions 9×23,458. Mean Bray–Curtis dissimilarity was 0.747, ranging from 0.558 for U3–M6 to 0.872 for U3–L9. A Mantel test, which correlates ecological and geographic distance matrices, detected significant distance-decay of community similarity (Spearman ρ = 0.323, p = 0.029, 9,999 permutations). NMDS (non-metric multidimensional scaling) had stress = 0.067, while Procrustes correspondence between community ordination and the physical grid was marginal (m² = 0.379, p = 0.080). 1
Report figures for the spatial analysis show a Bray–Curtis dissimilarity heatmap across the 9 SSO wells with row grouping, an NMDS ordination compared with the physical grid showing each well’s nearest community neighbor, a distance-decay scatter plot with pair annotations, and a Procrustes superimposition of the community ordination onto the grid. 1
Community turnover was not aligned with the uphill–downhill direction (Mantel ρ = −0.049, p = 0.580), but showed a stronger, though non-significant, association with the east–west axis (column Mantel ρ = 0.227, p = 0.092). The U3–M6–L7 pairs had the three most negative distance residuals: U3–M6 had Bray–Curtis = 0.558 and residual = −0.170, M6–L7 had Bray–Curtis = 0.615 and residual = −0.154, and U3–L7 had Bray–Curtis = 0.646 and residual = −0.133. U3–M4 had the largest positive residual (Bray–Curtis = 0.871, residual = +0.105). These results identify a northeast-to-southwest diagonal corridor whose shared community composition is interpreted as consistent with a contamination-plume flow path, but the hydrological explanation remains a testable inference rather than a direct measurement. 1
The report includes a residual-analysis figure showing the mean residual per well and Bray–Curtis dissimilarity by row separation. 1
The report places the SSO downhill and southwest of a contamination source at Oak Ridge Reservation Area 3, which it describes as delivering high-nitrate, low-pH water laden with heavy metals (uranium, chromium, nickel); in its model the plume enters the grid near U3 (upper-east) and flows diagonally toward L7 (lower-west), creating the Column 3 corridor. This source-and-route description is the report’s framing, not a flow path measured in this analysis. 1
The report’s conclusions state that the U3-M6-L7 corridor, identified purely from Bray–Curtis dissimilarity patterns, aligns with the expected NE→SW plume trajectory, and claim this demonstrates that 16S community similarity can map subsurface hydrology at meter scale; because no hydrological or geochemical measurements were analyzed, this remains an inference from community data. The generated spatial-statistics table (data/spatial_stats.csv) contains 36 pairwise comparisons with residuals. 1
Hydrogeological depth zonation
PERMANOVA (permutational multivariate analysis of variance) on 37 sediment core segments found that hydrogeological zone explained 27.5% of community variance (F = 4.05, p = 0.0001), whereas well identity explained 19.2% and was not significant (F = 0.80, p = 0.979). Samples from the same well but different depths had median Bray–Curtis dissimilarity = 0.977, while samples from the same depth zone in different wells had median Bray–Curtis dissimilarity = 0.835. The report interprets this pattern as evidence that depth and saturated-zone plume intersection dominate horizontal well identity. Its conclusions state that the vertical zonation (PERMANOVA R² = 27.5%) reflects the plume’s confinement to the saturated zone rather than generic depth gradients, and that communities above the water table are unaffected by contamination; no geochemical measurements were analyzed to confirm either statement, so this remains an interpretation. 1
A sample-level ordination figure in the report colors the sediment samples by hydrogeological zone and by well, showing the zone-over-well pattern. 1
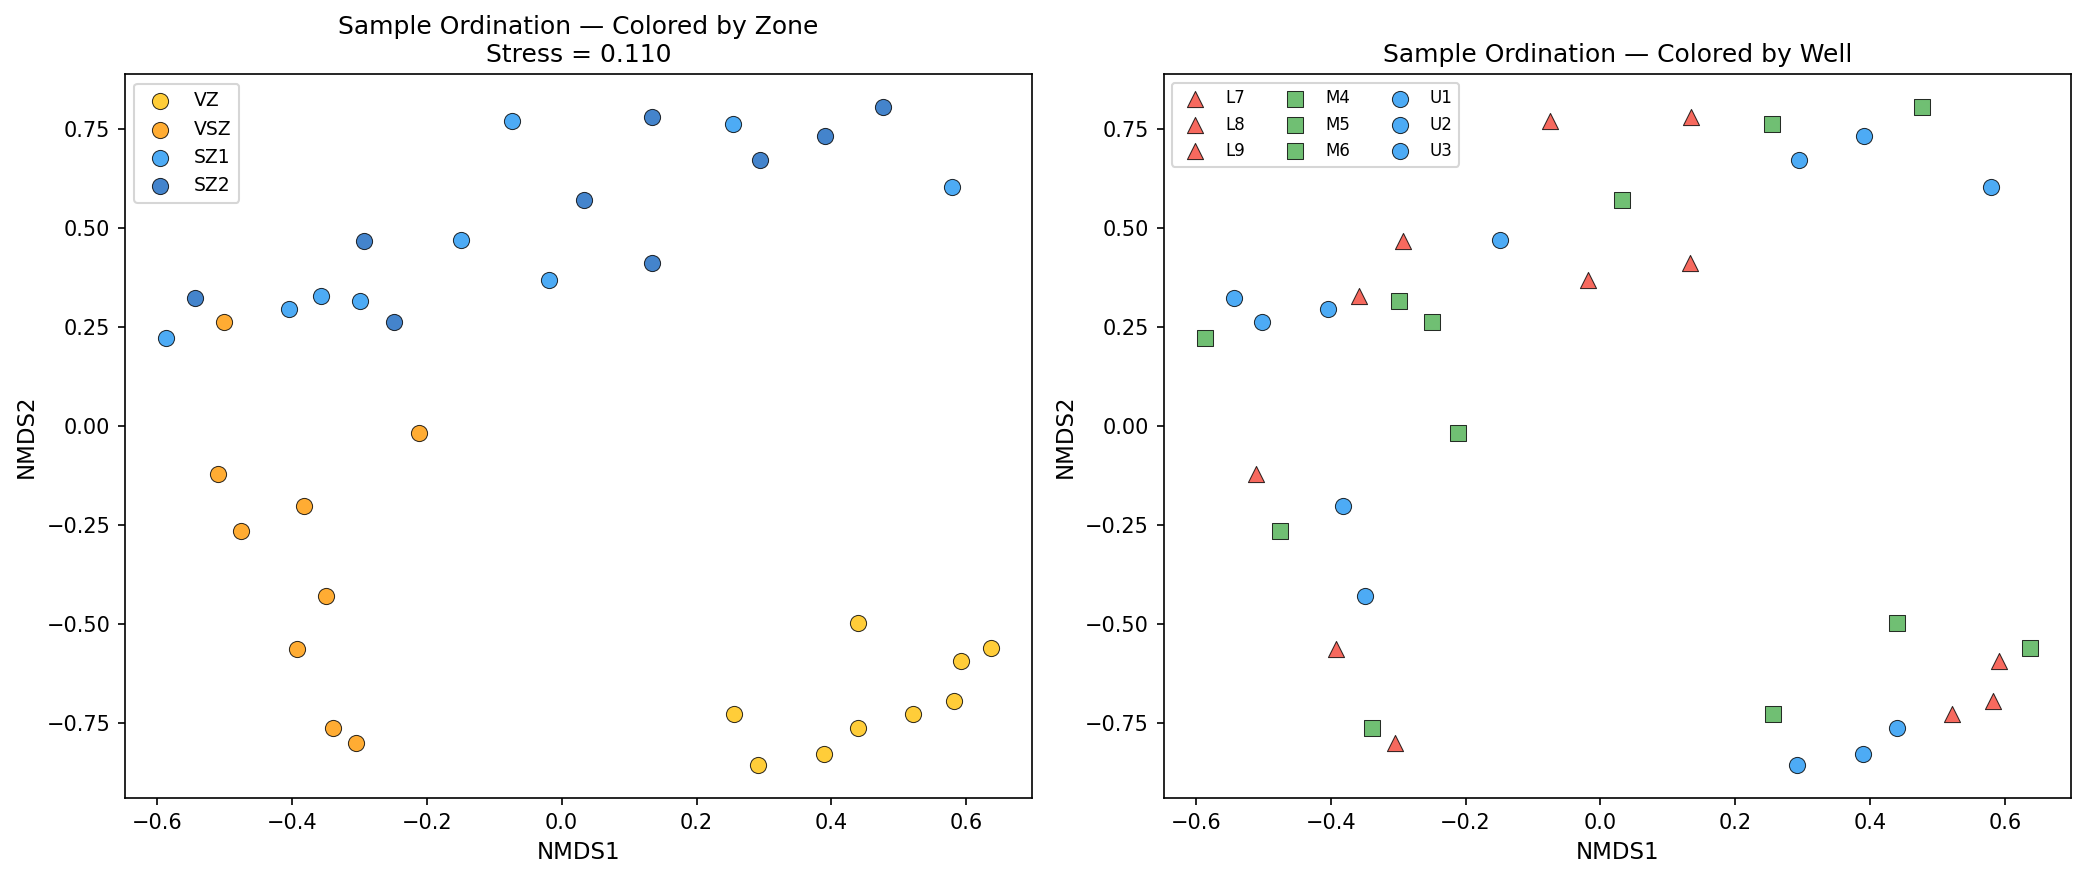 Sample-level ordination colored by zone and well. From enigma_sso_asv_ecology.
Further report figures show the well-grid geometry with inter-well distances, the depth-zone profile across wells, within-zone versus within-well dissimilarity, phylum composition by hydrogeological zone, and zone enrichment patterns for the top phyla. 1
The report states that 37 samples were classified by depth and description into VZ (33), VSZ (25), SZ1 (54), and SZ2 (45). Its data file of sample-to-hydrogeological-zone assignments lists 159 rows. These zone counts do not form one coherent set with the 37 core segments analyzed by PERMANOVA, and the report does not reconcile the denominators. Ten of 12 dominant phyla had significant depth associations at p < 0.05. Shallow-enriched groups included Chloroflexi (Spearman ρ = −0.73), Patescibacteria (−0.70), Myxococcota (−0.54), and Spirochaetota (−0.53); deep-enriched groups included Firmicutes (ρ = +0.76), WPS-2 (+0.52), Bacteroidota (+0.50), and Proteobacteria (+0.49). 1
The report’s phylum–depth correlation figure displays these shallow-enriched and deep-enriched phylum associations. 1
Inferred biogeochemical gradients
Multi-resolution functional inference covered 22 classes at 78% coverage and 65 annotated genera at 21% coverage. The class-level redox index ranged from 0.047 at M6 to 0.227 at U3. Genus-level inference covered 12 biogeochemical process categories and mapped process hotspots onto the grid, producing a spatial pattern interpreted as an inferred redox ladder rather than direct geochemical measurement. 1
Denitrification ranged from 1.9–7.7%, peaking at M5 with 7.7% and Rhodanobacter as the key genus. Iron oxidation peaked at U3 at 2.8%, with Sideroxydans; nitrification also peaked at U3 at 2.3%, with Ca. Nitrosotalea; iron reduction peaked at U1 at 2.3%, with Anaeromyxobacter; sulfur oxidation peaked at M4 at 1.9%, with Arcobacter and Thiobacillus; methanotrophy peaked at M4 at 1.9%, with Ca. Methanoperedens; and fermentation ranged from 2.0–5.3% and peaked at L9 at 5.3%, with Spirochaeta and Paenisporosarcina. 1
M5, the central well, hosts the highest inferred denitrification potential (7.7% Rhodanobacter) and is interpreted as a plume mixing zone where nitrate-rich contaminated groundwater meets native organic carbon, while M6 is interpreted as an anaerobic dead zone with the lowest inferred iron oxidation, sulfur oxidation, and nitrification. The report places oxidative processes near U3, denitrification near M5, and fermentation near L9 along an inferred sequence of O₂ → NO₃⁻ → Fe(III) → SO₄²⁻ → fermentation. These environmental assignments are hypotheses based on taxonomy-to-trait inference and await geochemical validation. 1
The report ties the M5 result to prior Oak Ridge Reservation (ORR) literature: Green et al. (2012) showed that Rhodanobacter species dominate bacterial communities in the most contaminated zones of the ORR subsurface, accounting for up to 45% of 16S sequences in low-pH, high-nitrate wells. The report reads its 7.7% Rhodanobacter at M5 as consistent with moderate plume influence, lower than the most contaminated Area 2 wells but elevated above background; the 45% figure is cited literature, not a measurement from this project. 1
Two report figures present this inference: a map of genus-inferred biogeochemical processes across the SSO grid, and a clustered heatmap of genus-level processes. 1
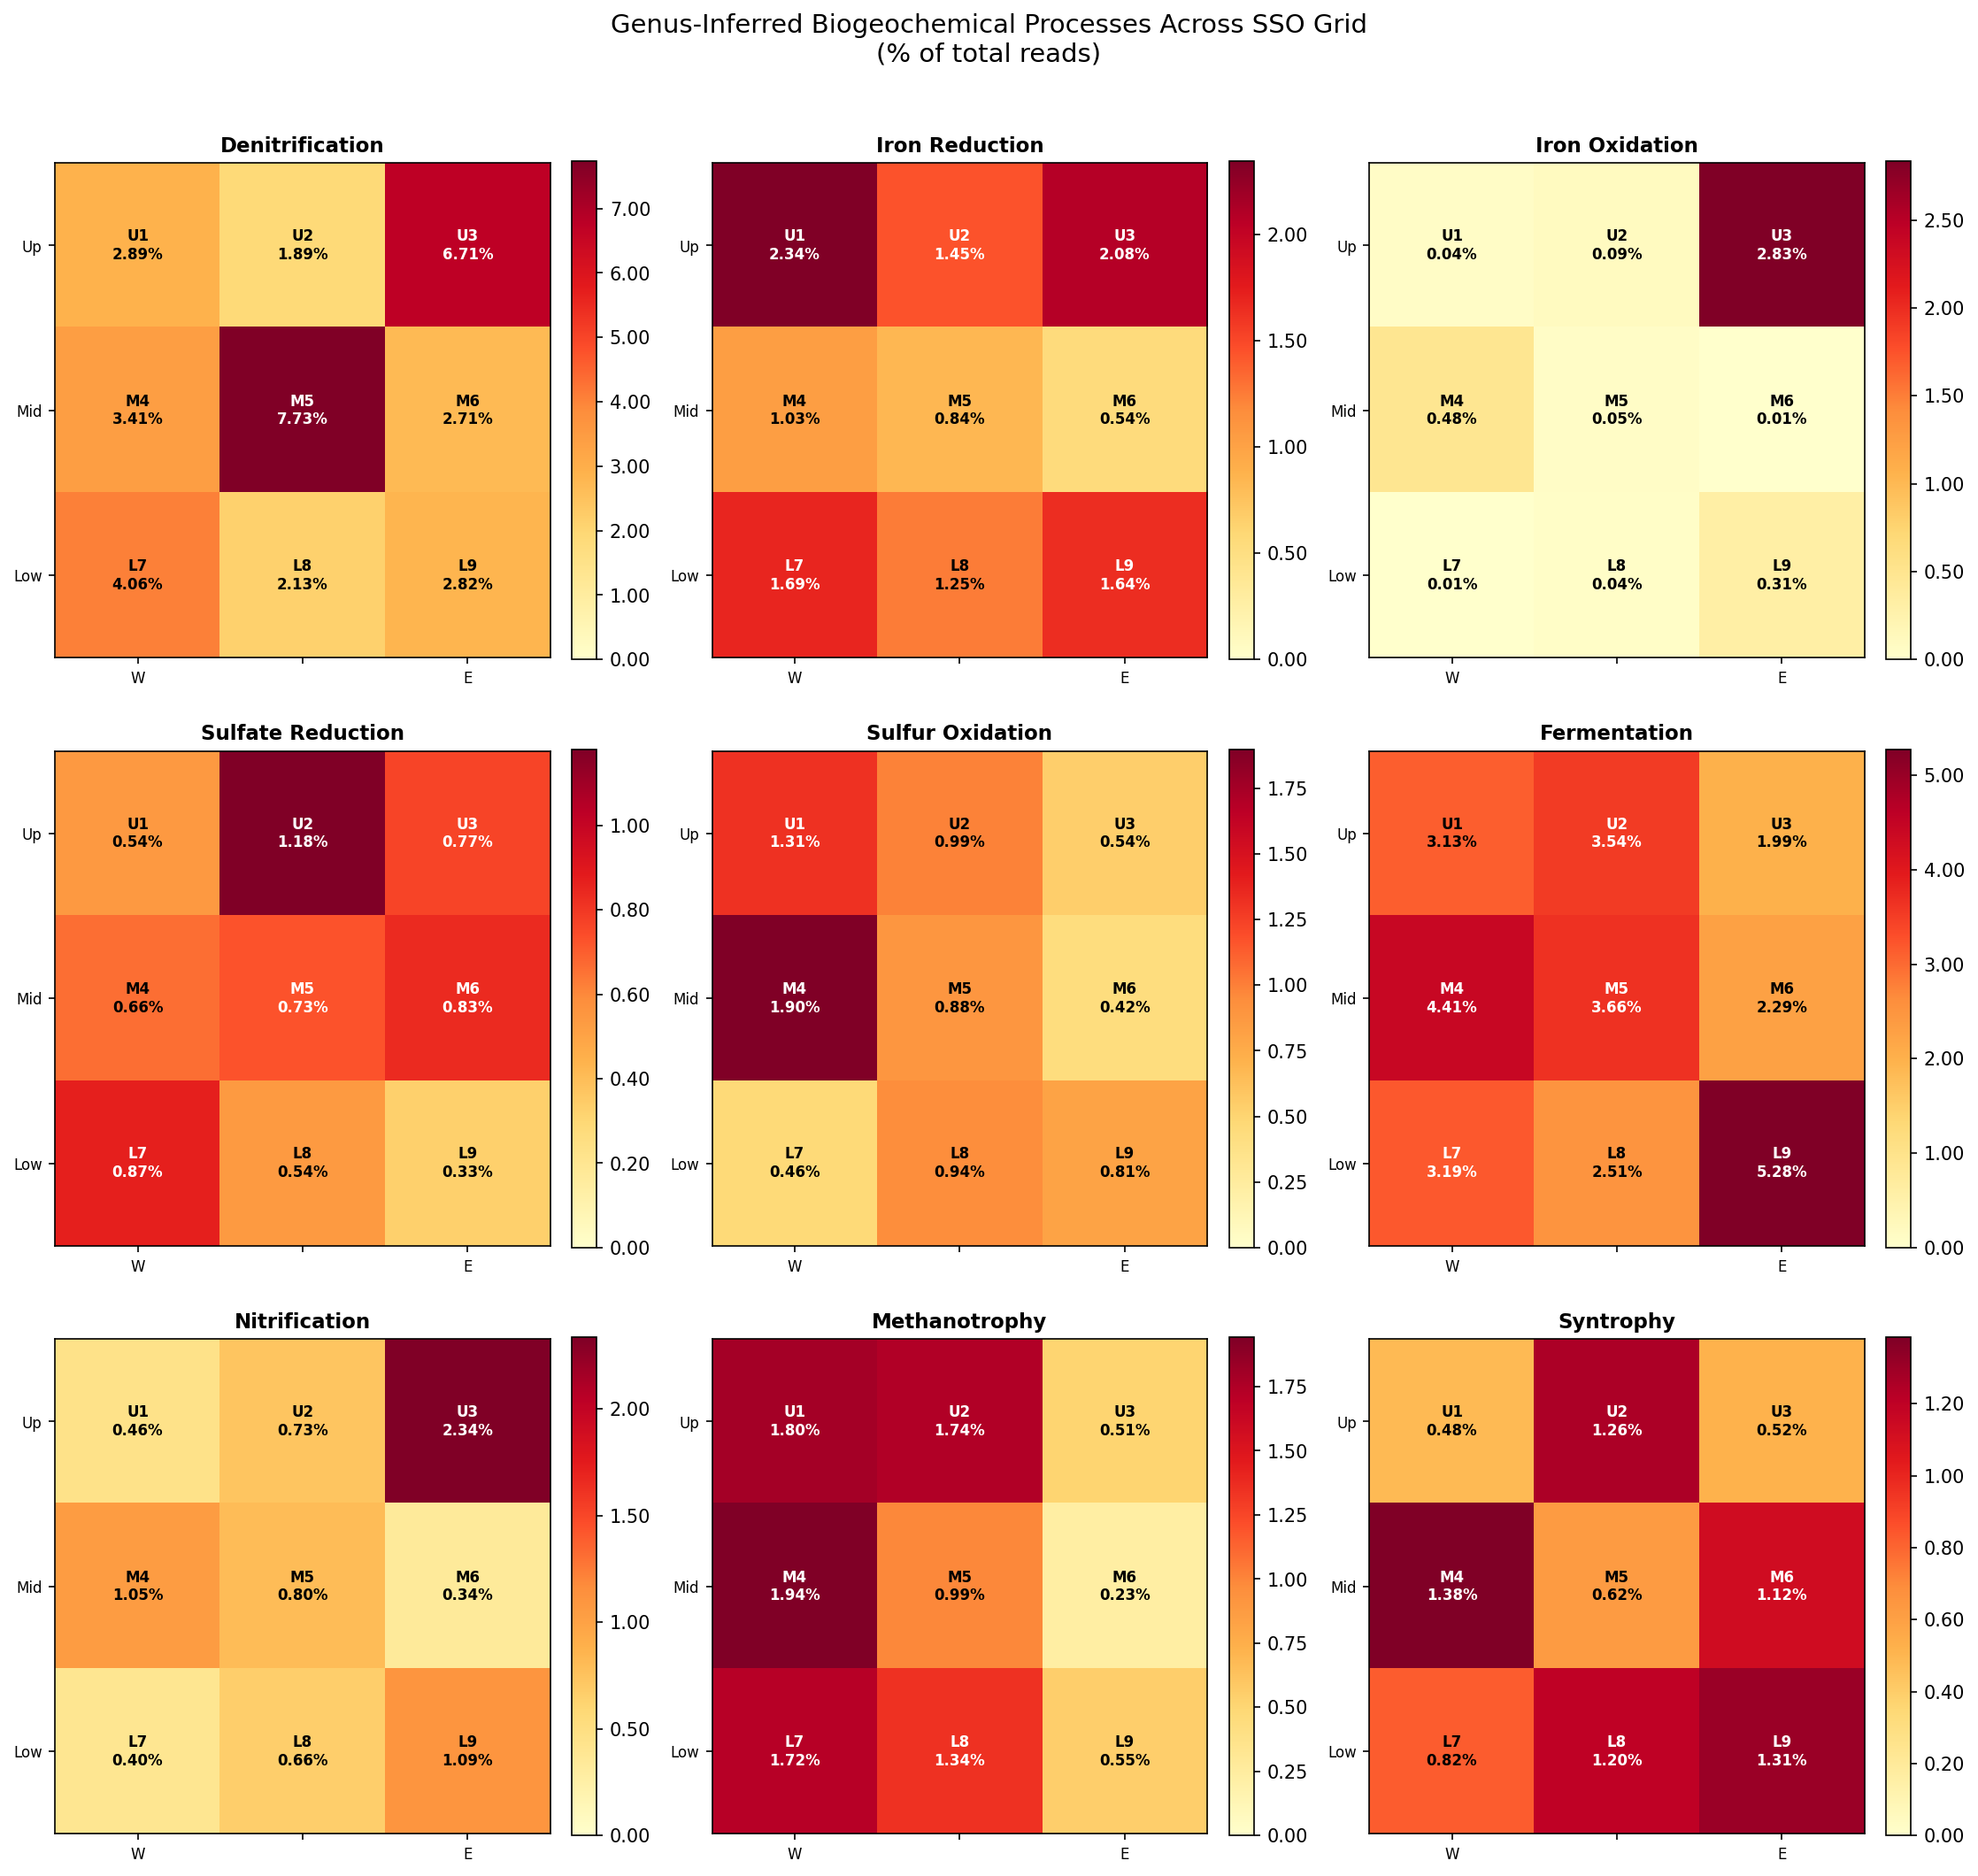 Genus-inferred biogeochemical processes across the SSO grid. From enigma_sso_asv_ecology.
Additional figures map all trait profiles onto the well grid, show key redox, fermentation and nitrogen functional gradients, and present a class-level trait clustermap. The report describes this as the first spatially explicit mapping of biogeochemical process distributions across the SSO 3×3 grid, inferred from 16S community composition at three taxonomic resolutions (phylum, class, genus); the processes were inferred, not directly measured. 1
Groundwater versus sediment communities
Groundwater and sediment communities collected at the same well differed substantially, with median Bray–Curtis dissimilarity = 0.424 and within-well values ranging from 0.364–0.450 across 5 wells. Groundwater was enriched in Rhodanobacter (sediment 1.23%, groundwater 3.62%, 2.9×), Gallionella (0.01%, 0.14%, 8.9×), and Sideroxydans (0.01%, 0.06%, 7.0×), while sediment was enriched in Anaeromyxobacter (1.24%, 0.03%, 0.02× in groundwater), Arcobacter (0.54%, 0.00%, 0×), and Ca. Methanoperedens (0.42%, 0.00%, 0×). Geobacter was 0.00% in sediment and 0.01% in groundwater, reported as 5.5× enriched in groundwater. 1
The report interprets groundwater enrichment in denitrifiers and iron oxidizers as a plume-associated planktonic assemblage, while sediment enrichment in anaerobic taxa indicates attached and planktonic communities are distinct rather than representing simple detachment. 1
In its discussion, the report describes Anaeromyxobacter dehalogenans, found throughout SSO sediments at 1.3% mean, as a model ENIGMA organism for iron and uranium reduction in the ORR subsurface (citing Thomas et al. 2010), and states that its 41× higher abundance in sediment than groundwater is consistent with a biofilm-forming, surface-attached lifestyle; the report does not reconcile these discussion values with the genus-level table above (sediment 1.24%, groundwater 0.03%). The report also compares its results with separate ORR work generating 77 sediment and 33 groundwater metagenomes (MRA 2025) on attached versus planktonic communities; those metagenomes are distinct data, and this project’s 16S results provide only complementary amplicon-level evidence for the same pattern. 1
A report figure compares phylum composition between groundwater and sediment samples at 5 wells. 1
Metabolic guild associations
Across 9 wells, 65 annotated genera were assigned to 11 metabolic guilds. Guild co-occurrence analysis found nitrifier × iron oxidizer correlation ρ = +0.95 (both concentrated at U3 and interpreted as plume-entry chemolithotrophs), syntroph × fermenter ρ = +0.55, fermenter × predator (Bdellovibrio) ρ = +0.85 (interpreted as predators tracking prey biomass), denitrifier × syntroph ρ = −0.67, and sulfate reducer × aerobic heterotroph ρ = −0.75. These associations are interpreted as inferred functional coupling or spatial separation across the redox gradient, not as direct interaction measurements. 1
The report reads the syntroph × fermenter coupling (ρ = +0.55) through the thermodynamic interdependence described by McInerney et al. (2009), in which syntrophic fatty acid degradation requires fermentation products (H₂, acetate, formate) to be kept at low concentrations, and reads the denitrifier × syntroph mutual exclusion (ρ = −0.67) through the canonical redox zonation of contaminated aquifers (Chapelle 2001). These are theory-based interpretations; the correlations alone do not establish obligate partnerships or causal segregation by electron-acceptor availability. 1
The report shows metabolic guild composition across wells as bar charts and summarizes the guild correlations in a guild co-occurrence matrix figure. 1
Groundwater temporal stability
Groundwater communities from 5 wells sampled 9 days apart, on September 9 and September 18, 2024, showed well identity explaining 49.9% of variance (p = 0.001), filter size explaining 10.1% (p = 0.001) and separating free-living from particle-associated fractions, depth within the saturated zone explaining 2.5%, a non-significant effect (p = 0.430), and date explaining 0.8%, with no detectable temporal change over the 9 days (p = 0.998). Median Bray–Curtis variation was 0.351 temporally, 0.750 between filter sizes, and 0.917 spatially. The date-1 versus date-2 distance matrices had Mantel ρ = 0.867 (p = 0.001), indicating that well-to-well similarity rankings were nearly unchanged over the 9-day interval. 1
This result supports persistent spatial structure at the 9-day groundwater timescale, but it does not establish long-term stability or resolve sediment temporal dynamics. Sediment cores were collected once per well during February–March 2023, and groundwater was sampled in September 2024, creating an 18-month material-and-time offset. 1
Two report figures support this section: one contrasts temporal and spatial groundwater variation, and the other shows spatial-pattern stability across the two sampling dates. 1
Caveats and Testable Predictions
Direct SSO geochemistry is unavailable in the analyzed dataset: 221 geochemistry sample tubes are registered in CORAL, but metals, ion chromatography/total organic carbon, isotopes, ammonia, and nitrite measurements have not been loaded. Consequently, the proposed northeast-to-southwest plume, the M5 mixing-zone interpretation, the M6 plume-core interpretation, and the inferred redox ladder are environmental hypotheses based on community composition and trait inference. All environmental inferences come from community composition alone. Loading the measurements from the 221 registered geochemistry samples (metals, IC/TOC, isotopes, NH₃/NO₂) would allow direct correlation of community composition with measured environmental parameters, validating or refuting the plume model. 1
Groundwater ASV coverage exists for only 5 of 9 wells—L7, L9, M4, M6, and U2—and excludes the critical inferred hotspot wells M5 and U3. The denitrification and iron-oxidation hotspot interpretations therefore rest on sediment data, and the report states that groundwater validation at these wells would substantially strengthen the plume model. Pump-test ASV data from Brick 460-462 for L8, M5, and U2 remains available for future extraction. The predicted groundwater pattern is that Rhodanobacter will be highest at M5 and lower at L8 and U2. 1
Genus-level functional annotation covered only 21% of total reads, with 65 of 1,038 genera annotated; the report therefore treats process abundance estimates as lower bounds. Genus-level taxonomy covered 44% of sediment reads, species-level classification was approximately 0%, and 56% of reads remained outside the genus-level inference. Class-level traits had 78% coverage and showed consistent redox patterns, but the report recommends sensitivity analysis against the lower-coverage genus-level results. 1
Trait scores at phylum and class levels are consensus estimates rather than empirical measurements of the specific SSO populations, and functional assignments are based on literature-linked taxonomy rather than direct genomic evidence. Metagenomics at the same spatial resolution is proposed to test these assignments and capture the 56% of reads without genus-level classification. 1
The sediment–groundwater comparison is confounded by the 18-month sampling offset (sediment cores Feb–Mar 2023, groundwater Sep 2024), sediment has no within-well temporal replication, and seasonal or plume dynamics could affect the comparison. The report also notes that the single sediment timepoint cannot assess temporal dynamics, while the 9-day groundwater result cannot establish stability across seasons or longer plume fluctuations. 1
The most direct resolving analyses are to load the 221 SSO geochemistry samples into CORAL; test whether nitrate, pH, and metal concentrations form the predicted northeast-to-southwest gradient, with highest contamination at U3/M6 and lowest at M4/U1; examine nearby EU/ED well metals from the 100WS/27WS bricks, 90–120 m NE of SSO, which are predicted to show metal concentrations decreasing toward the SSO if the plume approaches from the northeast; extract pump-test ASVs from Brick 460-462 as a third temporal snapshot (Mar 2024) from L8, M5 and U2 to test the M5 denitrification-hotspot prediction; analyze the 18 M6-C2 isolate genomes, which are predicted to encode anaerobic metabolisms (fermentation, sulfate reduction) consistent with M6’s inferred plume-core position, a genomic check not reported here; perform weighted UniFrac using ASV sequences from Bricks 457/460/477, which the report suggests may be more sensitive to plume effects than Bray–Curtis on ASV counts, though this is not demonstrated; and repeat 16S profiling across seasons and plume dynamics to reveal whether community structure tracks plume fluctuations. All of these are predictions awaiting data, not confirmed results. 1
The SSO sediment and groundwater 16S ASV data, sample metadata and well coordinates were drawn from the enigma_coral collection (enigma-coral), including the sdt_sample, sdt_location, sdt_community, ddt_ndarray, ddt_brick0000457-459 and ddt_brick0000477-479 tables. 1
Slots Into
- ecotype-environment-gene-content — supports an environment-linked community-structure model in which hydrogeological zone, depth, spatial arrangement, and inferred plume exposure differentiate microbial assemblages. 1
- subsurface-bacillota-specialization — contributes depth-associated enrichment of Firmicutes and a subsurface redox-gradient interpretation, while emphasizing that the functional assignments are inferred rather than directly measured. 1
- environmental-resistome — provides a contamination-plume framework linking metal-rich groundwater, spatial microbial turnover, and plume-associated taxa, without direct resistome measurements. 1
- multi-omics-integration — identifies the missing geochemistry, metagenomics, isolate-genome, and phylogenetic community data needed to validate 16S-based functional inference. 1
- subsurface-hydrogeological-zonation — supplies the core evidence: zone explains more sediment variance than well identity, phyla are associated with depth, wells U3, M6 and L7 form a corridor, groundwater and sediment communities differ, and groundwater communities stay stable over 9 days. 1
- environment-embedding-geography — adds a meter-scale distance-decay result with only a marginal Procrustes fit to the physical grid. 1
- taxonomic-resolution-dependent-functional-inference — contrasts class-level (78% coverage) and genus-level (21% coverage) trait inference of the same processes. 1
- functional-marker-validation — genus-inferred process hotspots are taxonomy-to-trait assignments that still need geochemical and metagenomic validation. 1
- gene-cooccurrence-ecological-guilds — guild co-occurrence correlations across 9 wells are interpreted as functional coupling or redox separation, not demonstrated interactions. 1
- study-batch-confounding-of-environmental-associations — the 18-month offset between sediment and groundwater sampling confounds material type with time. 1
- callability-limited-comparative-inference — groundwater ASV data cover only 5 of 9 wells (L7, L9, M4, M6, U2) and miss the inferred hotspot wells M5 and U3, so the groundwater side cannot test the main plume-model inferences. 1