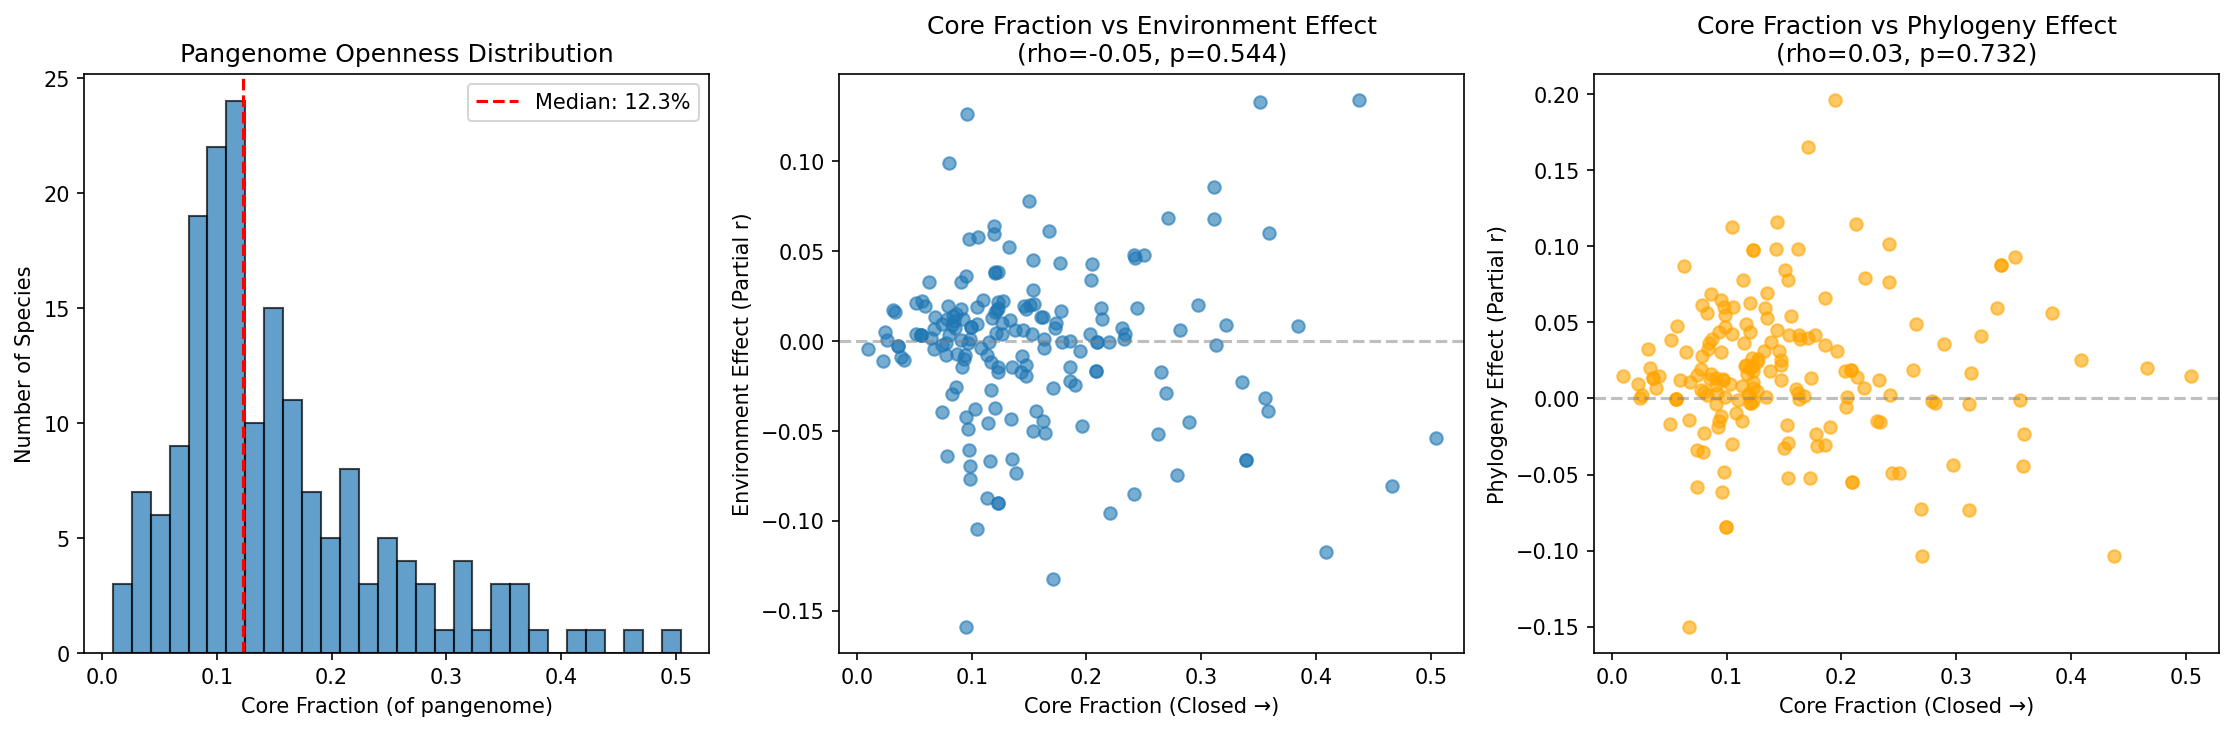
Analysis of pangenome openness vs environment/phylogeny effects revealed no significant relationship:
Metric
Spearman rho
p-value
Openness vs Environment effect
-0.05
0.54
Openness vs Phylogeny effect
0.03
0.73
(Notebook: 01_explore_gene_data.ipynb)
Interpretation
Whether a species has an open or closed pangenome does not predict whether environment or phylogeny dominates its gene content. This suggests:
Pangenome structure is independent of eco-phylo dynamics: Open pangenomes don’t necessarily mean environment-driven adaptation
HGT may not track environmental similarity: Gene acquisition might be opportunistic rather than niche-specific
Core/accessory classification may not capture functional adaptation: The genes that vary may not be the ones responding to environment
Literature Context
Tettelin et al. (2005) introduced the open/closed pangenome framework for bacterial genomes. Our null result suggests that the open/closed distinction, while useful for describing gene content variability, does not predict the ecological vs phylogenetic drivers of that variability.
McInerney et al. (2017) argued that pangenome structure reflects a balance of selection, drift, and HGT. Our finding that openness is uncorrelated with environment effects is consistent with HGT being opportunistic rather than ecologically directed.
Parks et al. (2022) provided the GTDB taxonomy and pangenome framework used here, enabling consistent cross-species comparisons of pangenome structure.
Limitations
Sample size is limited to species with both pangenome statistics and ecotype analysis results
Openness is a single summary metric that may not capture the full complexity of pangenome structure
Environment and phylogeny effects are derived from partial correlations that may not fully disentangle confounded variables
The ecotype analysis upstream may have limited statistical power for some species with few genomes
Future Directions
Stratify by gene function: Do open pangenomes show environment effects specifically in L (mobile) or V (defense) categories?
Test alternative openness metrics: Try auxiliary fraction, Heap’s law alpha, or pangenome fluidity
Lifestyle interaction: Test openness x lifestyle interaction (e.g., open pathogens vs open environmental species)
Data
Sources
Dataset
Description
Source
KBase pangenome statistics
Pre-computed openness metrics per species
pangenome table via Spark
Ecotype analysis results
Environment and phylogeny effect sizes
ecotype_analysis project
Generated Data
File
Description
data/pangenome_stats.csv
Pre-computed pangenome statistics for target species
data/pangenome_ecotype_merged.csv
Merged pangenome stats with ecotype analysis results
data/species_selection_stats.csv
Species selection statistics
data/target_genomes_expanded.csv
Expanded target genome information
References
Parks DH et al. (2022). “GTDB: an ongoing census of bacterial and archaeal diversity through a phylogenetically consistent, rank normalized and complete genome-based taxonomy.” Nucleic Acids Res 50:D199-D207. PMID: 34520557
Tettelin H et al. (2005). “Genome analysis of multiple pathogenic isolates of Streptococcus agalactiae: implications for the microbial ‘pan-genome’.” Proc Natl Acad Sci USA 102:13950-13955. PMID: 16172379
McInerney JO et al. (2017). “Why prokaryotes have pangenomes.” Nat Microbiol 2:17040. PMID: 28350002
Supporting Evidence
Notebooks
Notebook
Purpose
notebooks/01_explore_gene_data.ipynb
Understand gene table structure and pangenome statistics
Figures
Figure
Description
figures/pangenome_vs_effects.png
Scatter plots of pangenome openness vs environment and phylogeny effect sizes
Revision History
v1 (2026-02): Migrated from README.md
v2 (2026-02): Added inline figure, notebook provenance, Data section, Literature Context, Limitations, References, renamed Visualizations to Figures