Key Findings
Conservation Increases with Fitness Importance
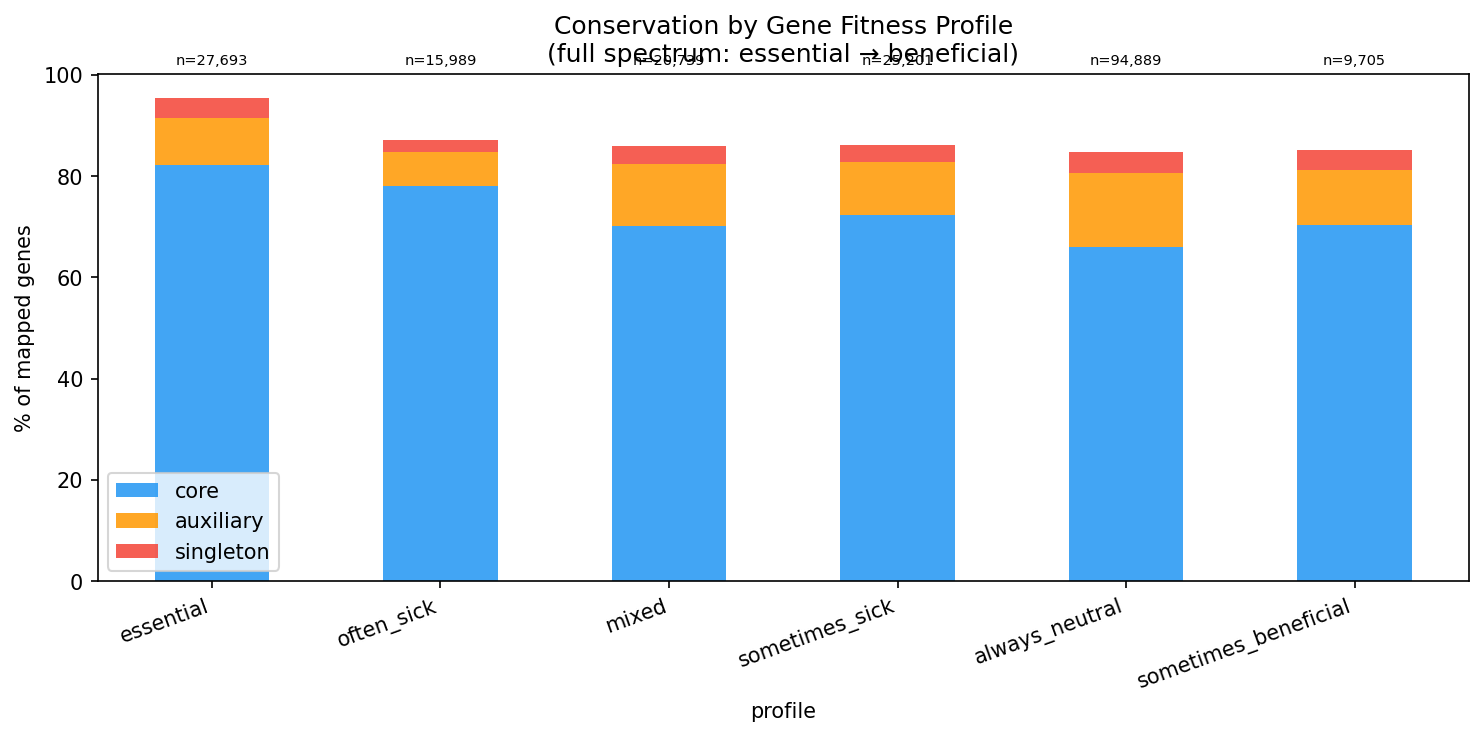
A clear gradient from essential to neutral genes:
| Fitness category | n genes | % Core |
|---|---|---|
| Essential (no viable mutants) | 27,693 | 82% |
| Often sick (>10% experiments) | 15,989 | 78% |
| Mixed (sick + beneficial) | 20,739 | 70% |
| Sometimes sick | 25,201 | 72% |
| Always neutral | 94,889 | 66% |
| Sometimes beneficial | 9,705 | 70% |
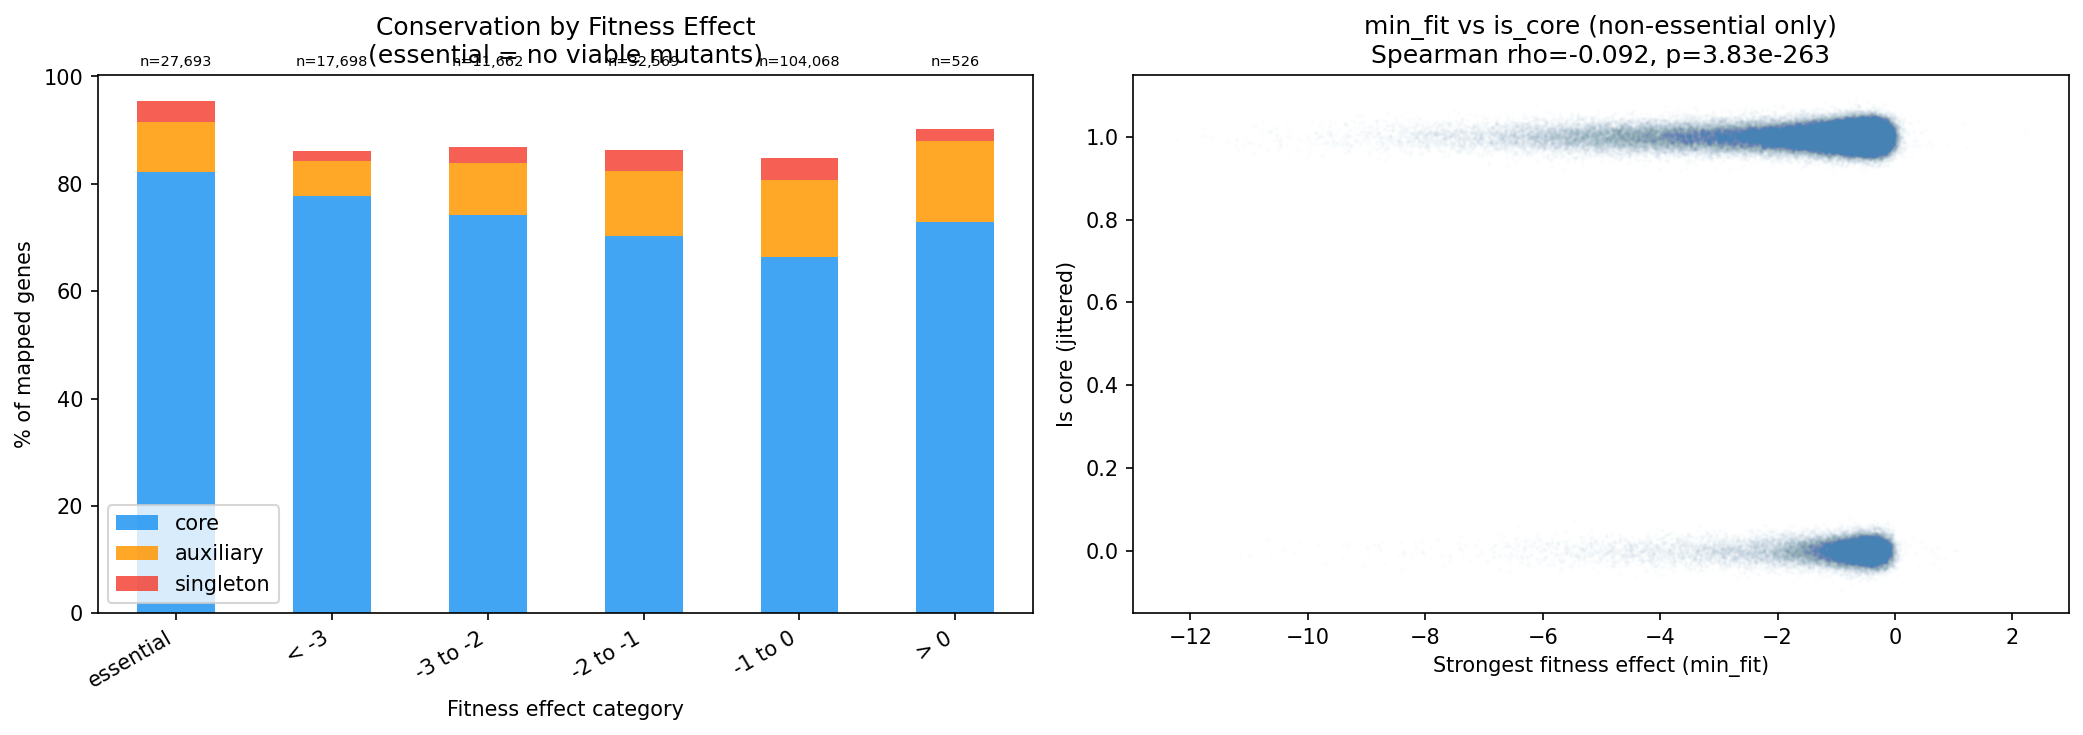
The same gradient holds when binning by strongest fitness effect: essential -> 82.2% core, min_fit < -3 -> 77.7%, min_fit -1 to 0 -> 66.4%.
(Notebook: 02_fitness_vs_conservation.ipynb)
Breadth of Fitness Effects Predicts Conservation
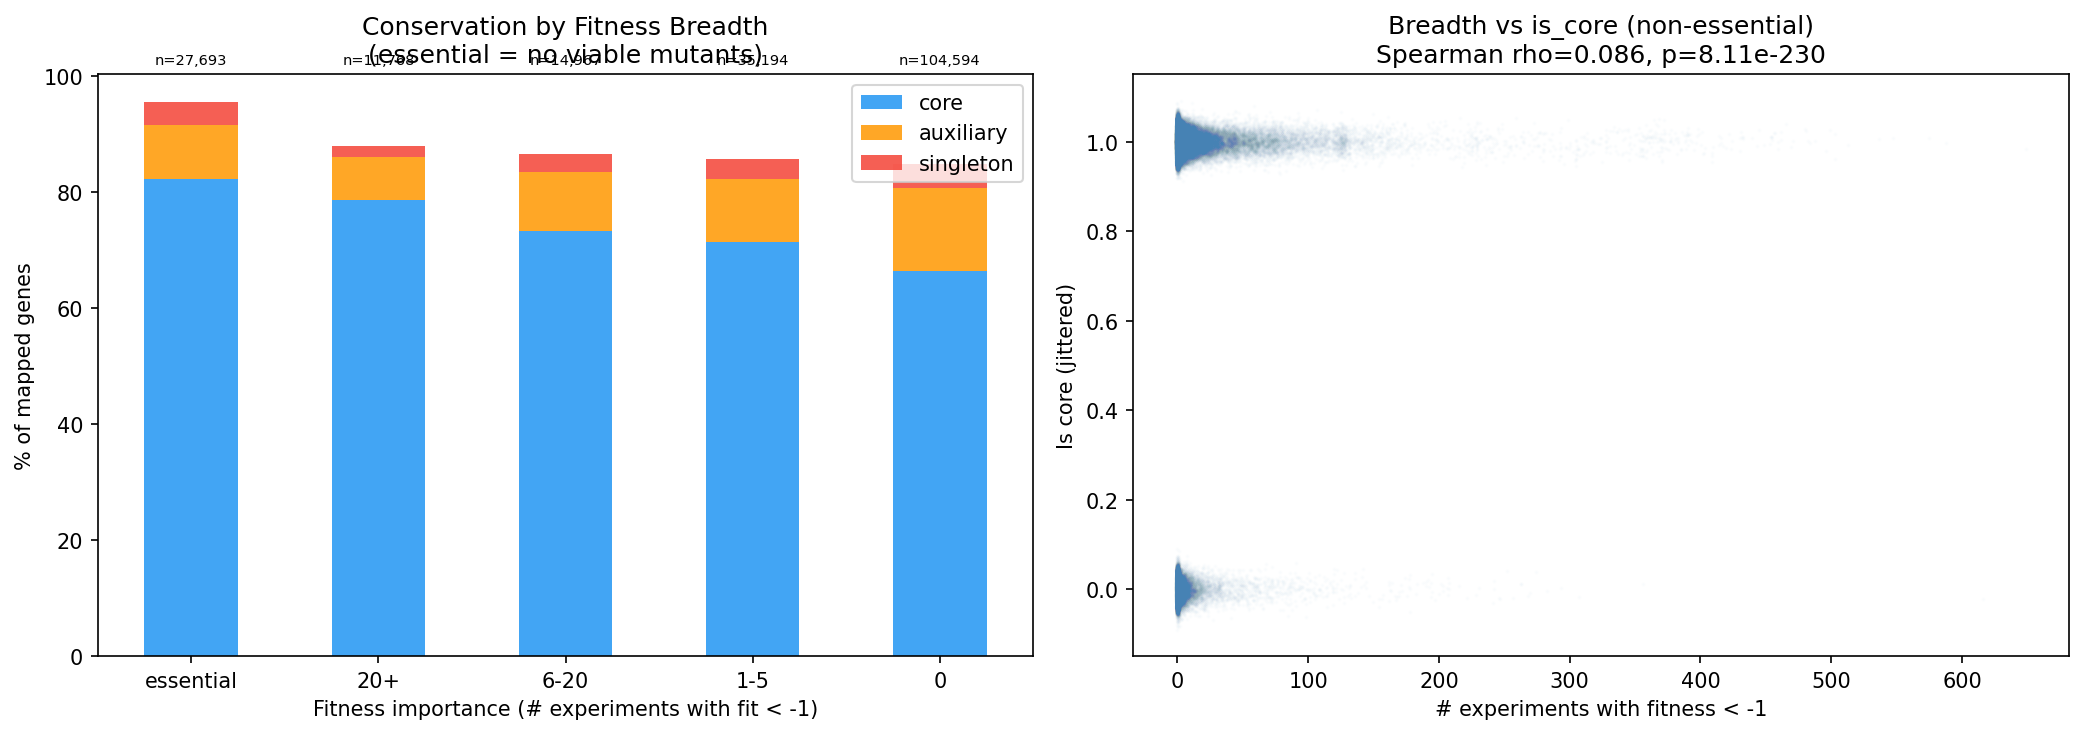
Genes important in more conditions are more likely core (Spearman rho=0.086, p=8.1e-230):
| Breadth | % Core |
|---|---|
| Essential | 82% |
| 20+ experiments | 79% |
| 6-20 experiments | 73% |
| 1-5 experiments | 71% |
| 0 experiments | 66% |
(Notebook: 03_breadth_vs_conservation.ipynb)
Core Genes Are Not Burdens — They’re More Likely Beneficial
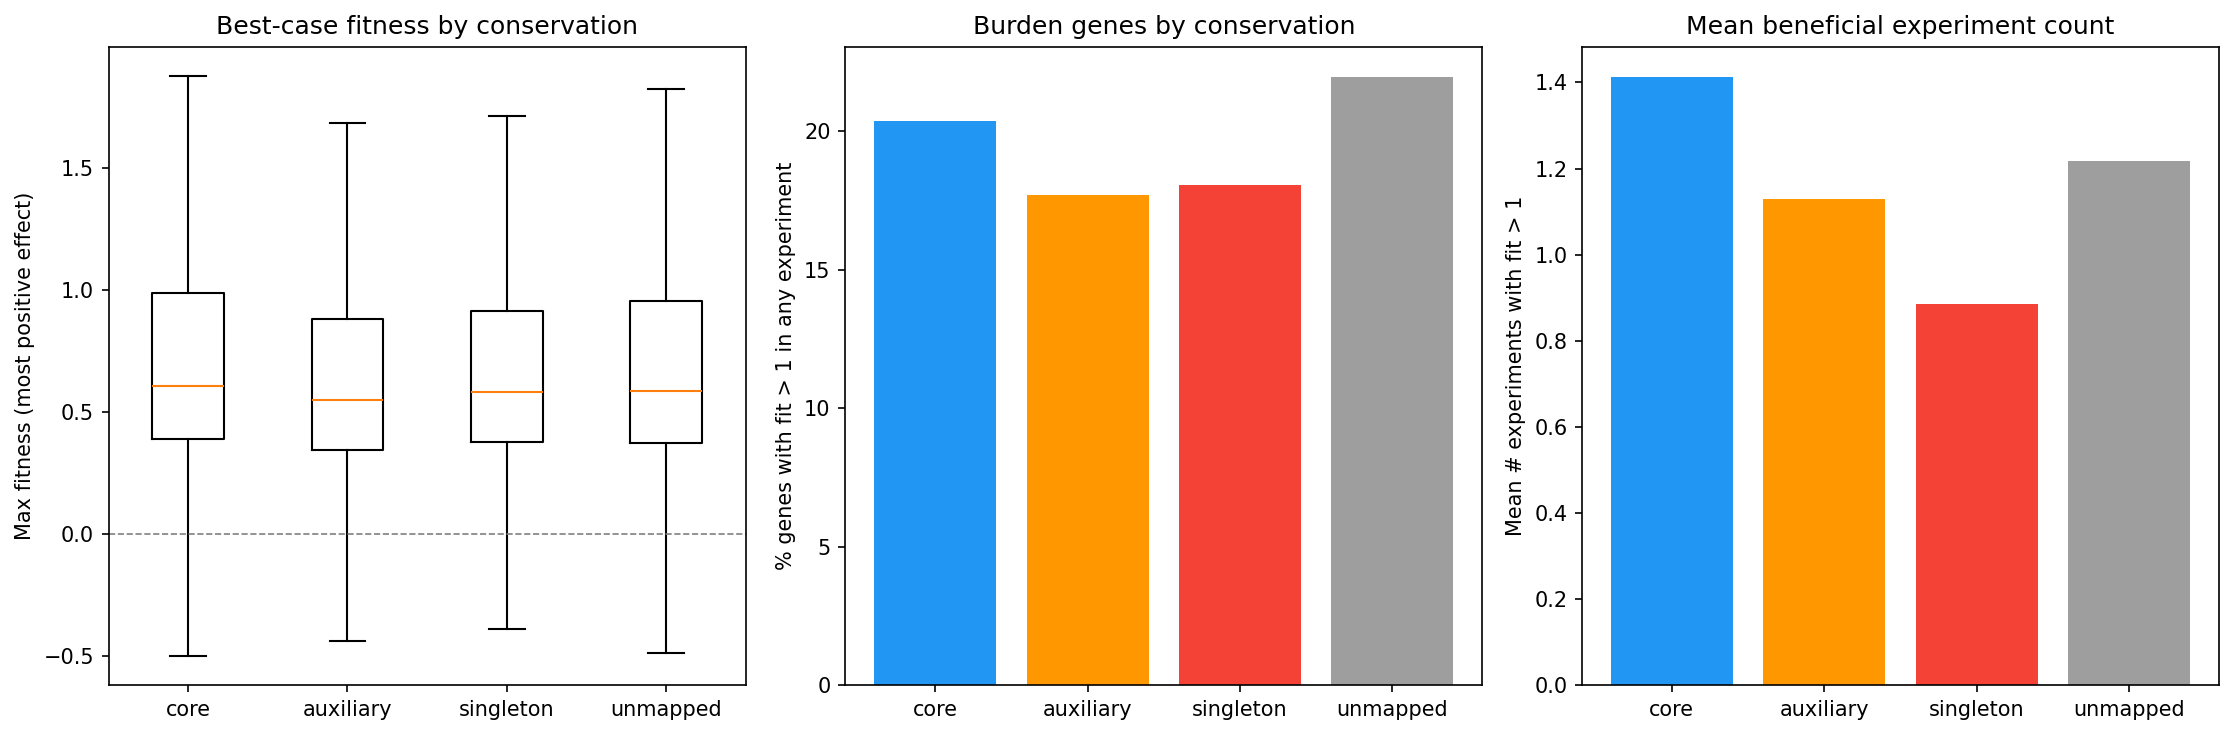
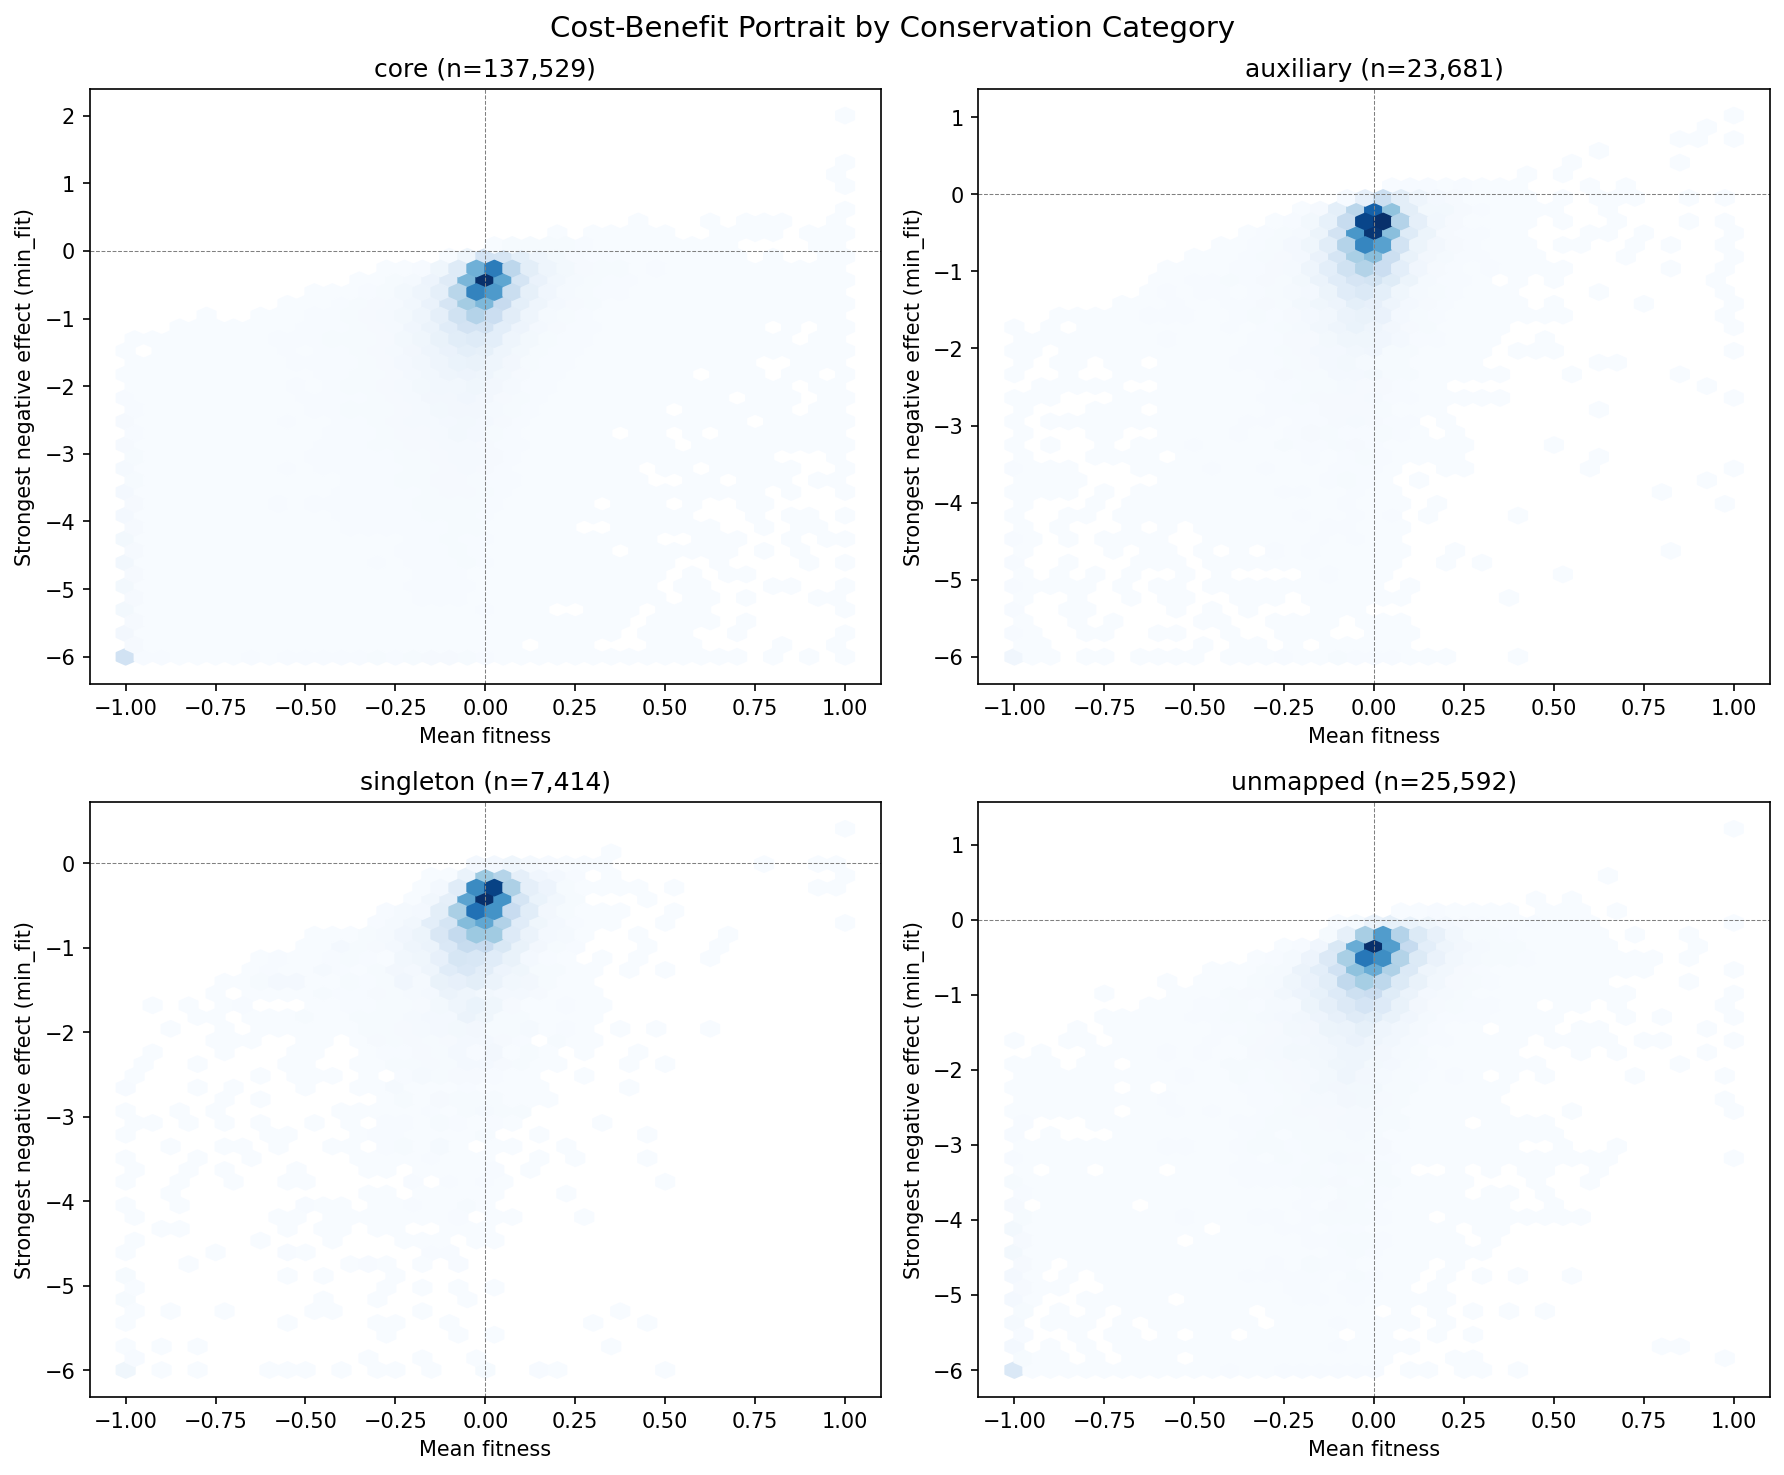
Counter to the expectation that accessory genes might be costly to carry, core genes are MORE likely to show positive fitness effects when deleted (24.4% ever beneficial vs 19.9% for auxiliary, OR=0.77 for auxiliary vs core). This may reflect that core genes are more likely to participate in trade-off situations — they help in some conditions but cost in others.
(Notebook: 02_fitness_vs_conservation.ipynb)
Specific-Phenotype Genes Are More Likely Core
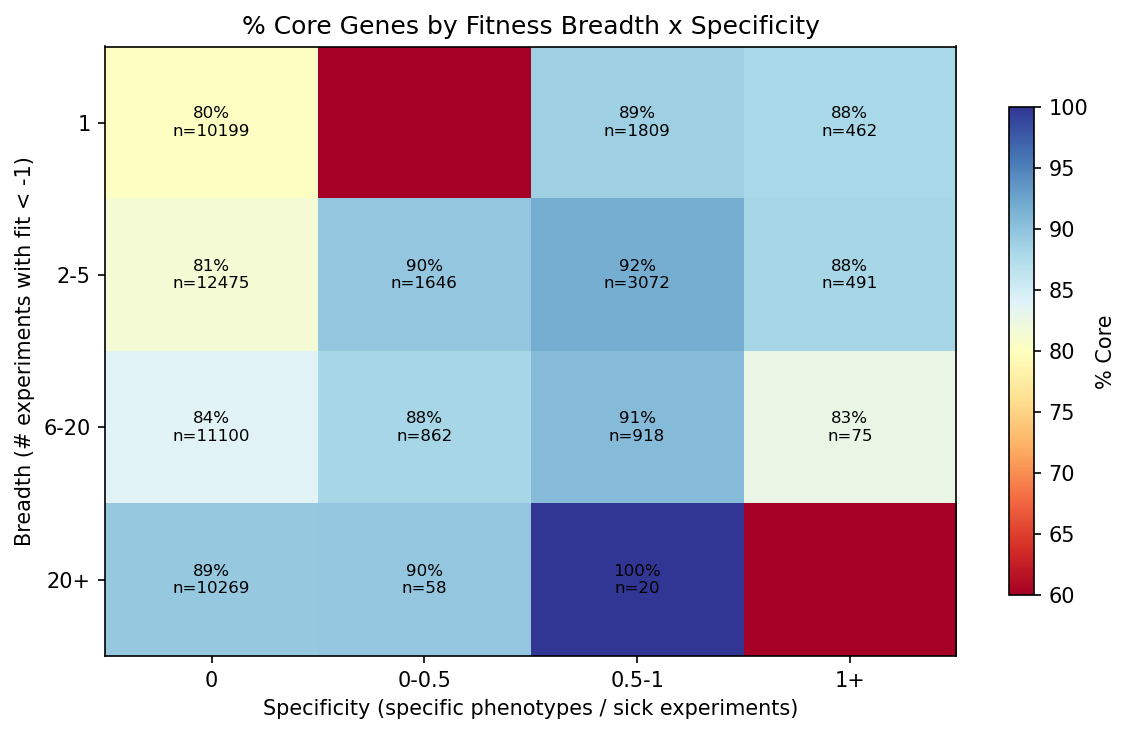
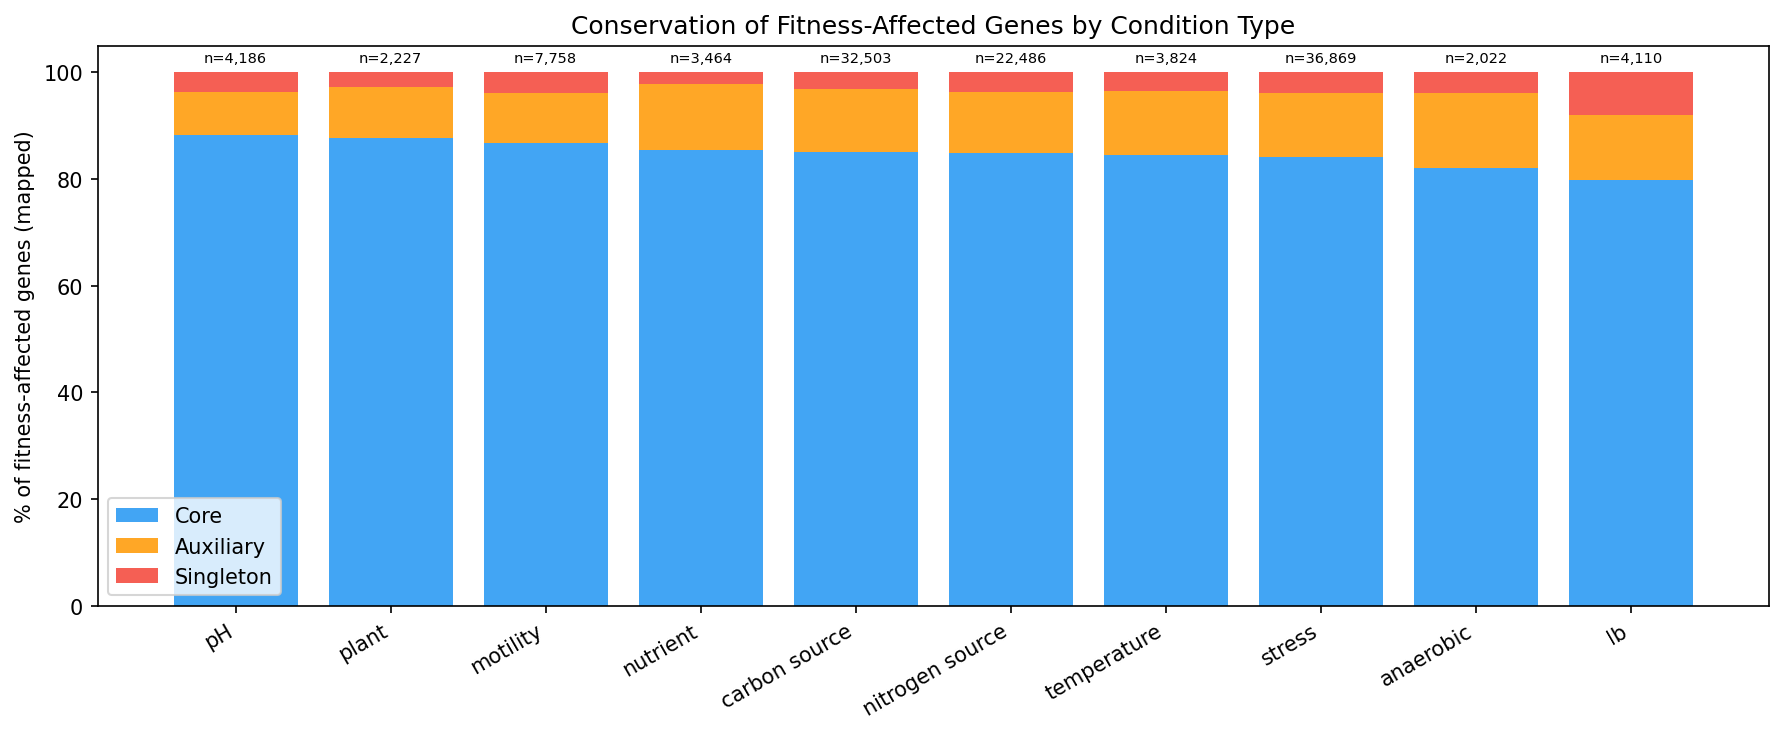
Genes with strong condition-specific effects (tagged in specificphenotype) are 77.3% core vs 70.3% for genes without specific phenotypes (OR=1.78, p=1.8e-97). This contradicts the naive expectation that condition-specific genes would be accessory. Instead, it suggests that core genes are more likely to have measurable condition-specific effects — perhaps because they participate in well-characterized pathways.
(Notebook: 03_breadth_vs_conservation.ipynb)
Ephemeral Niche Genes
4,450 genes (2.7%) fit the “ephemeral niche gene” pattern: neutral overall but critical in one condition. Surprisingly, these are MORE common in core genes (3.0%) than auxiliary (1.7%) or singleton (1.6%). Core genes may simply have more detectable conditional effects because they participate in more pathways.
Fitness Distributions by Conservation
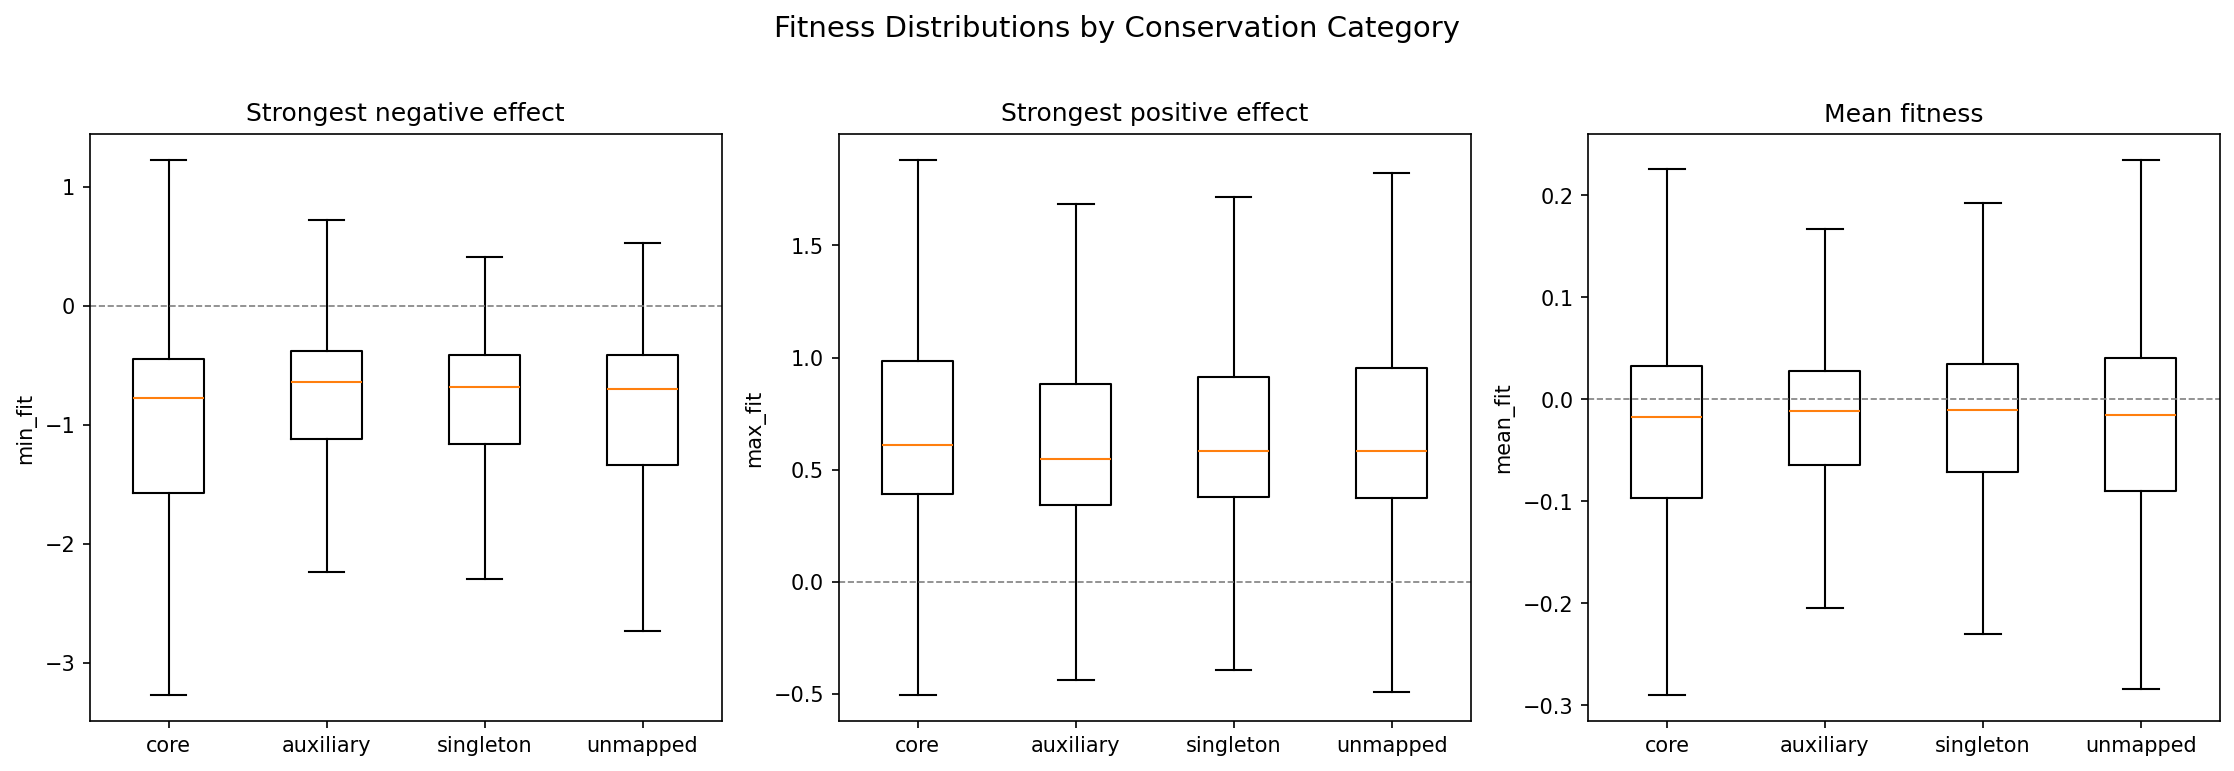
Core and auxiliary genes show distinct fitness effect distributions, with core genes having heavier tails in both the negative (important) and positive (burdensome) directions.
(Notebook: 02_fitness_vs_conservation.ipynb)
Novel Gene Landscape
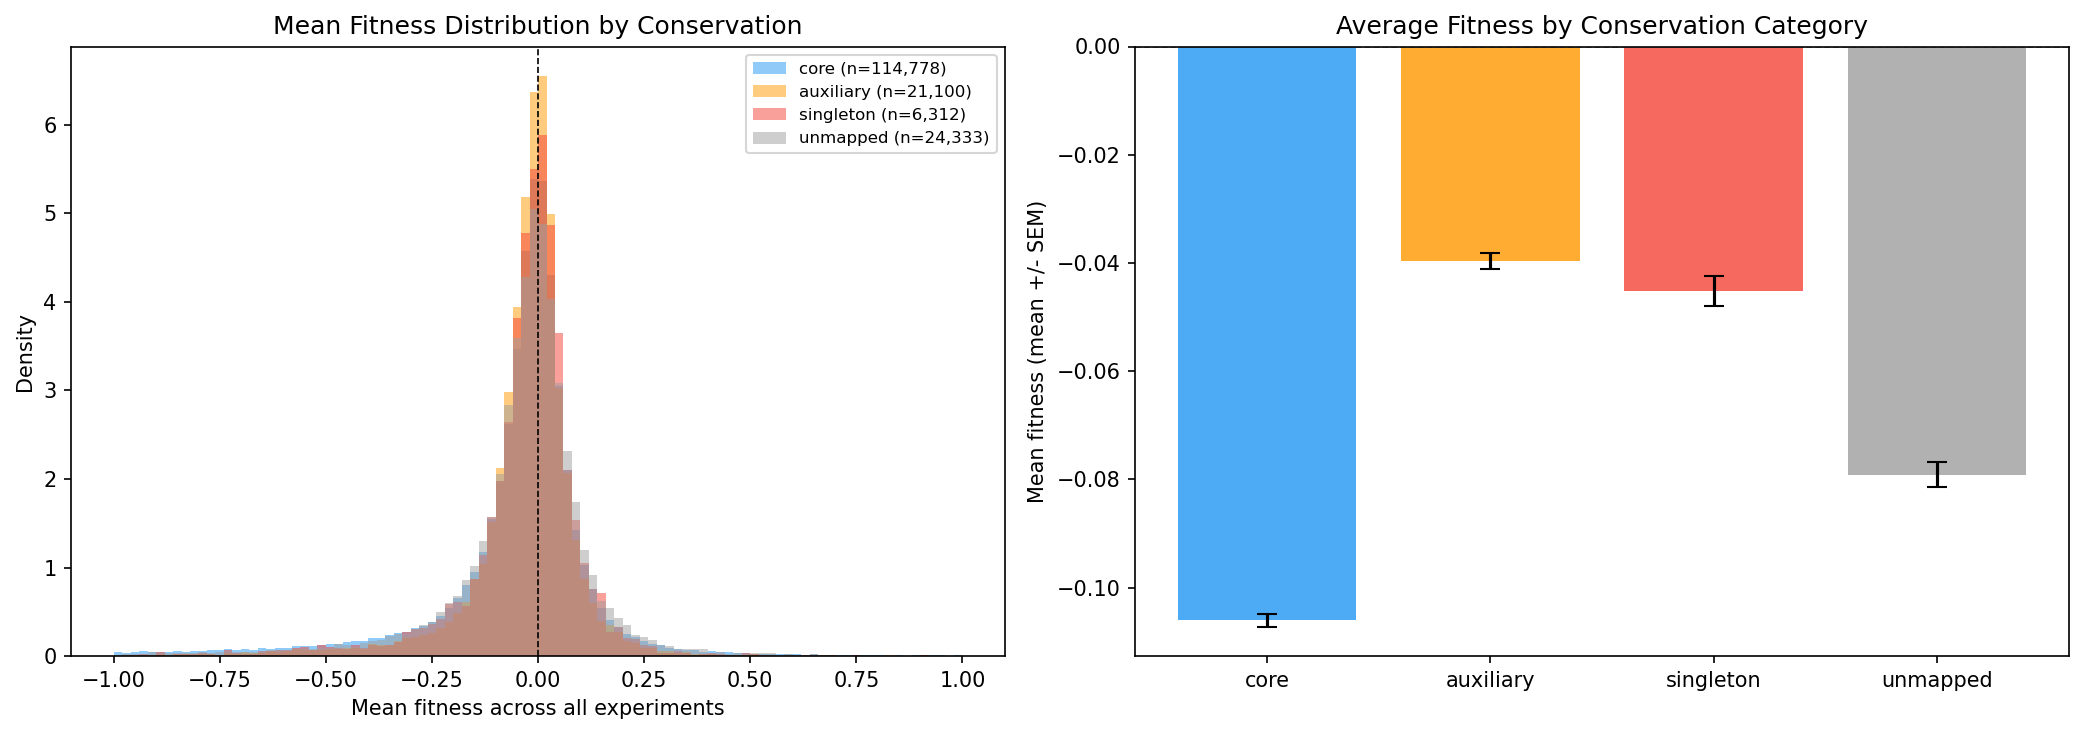
Novel (singleton) genes show near-zero mean fitness, suggesting they are largely invisible to lab-based fitness assays — neither beneficial nor detrimental under tested conditions.
(Notebook: 02_fitness_vs_conservation.ipynb)
Interpretation
The results paint a consistent picture: gene fitness importance and pangenome conservation are positively correlated across the full spectrum. Essential genes are 82% core; always-neutral genes are 66% core. This 16-percentage-point gradient spans ~194,000 genes across 43 diverse bacteria.
However, several findings challenge simple models:
- Core genes are more likely to be both detrimental (essential) AND beneficial (burden) when deleted — they’re more extreme, not more neutral
- Condition-specific fitness genes are more core, not more accessory
- Novel/singleton genes are NOT systematically detrimental — their mean fitness is near zero, similar to auxiliary genes
These patterns suggest that core genes are the most functionally active genes — they have the largest fitness effects in both directions because they’re embedded in critical pathways. Accessory genes, by contrast, tend to be functionally quieter under lab conditions.
Literature Context
- Price et al. (2018) generated the Fitness Browser data used here, providing the largest resource of genome-wide mutant fitness data for bacteria. Our analysis adds a pangenome conservation dimension to their fitness measurements.
- Luo et al. (2015) showed that core genes have stronger purifying selection than accessory genes across bacterial species, consistent with our finding that genes with stronger fitness effects are more likely core.
- McInerney et al. (2017) reviewed the gene-sharing network view of pangenomes, arguing that gene frequency distributions reflect a balance of selection, drift, and HGT. Our fitness-conservation gradient provides empirical support for selection as a major driver of core gene maintenance.
Limitations
- Lab conditions are biased toward rich media and standard stresses; many ecological niches are unrepresented
- The 16pp gradient, while statistically robust, means conservation is only weakly predicted by fitness importance
- Fitness measurements are for single-gene knockouts; epistatic interactions are not captured
- The Fitness Browser covers 43 bacteria — primarily Proteobacteria — limiting generalizability
- Singleton/novel genes may lack fitness data due to poor transposon coverage rather than true neutrality
Data
Sources
| Dataset | Description | Source |
|---|---|---|
| Fitness Browser | RB-TnSeq mutant fitness data for ~194K genes | Price et al. (2018) |
| KBase pangenome link table | Gene-to-cluster conservation mapping | conservation_vs_fitness/data/fb_pangenome_link.tsv |
| Essential genes | Essentiality classification | conservation_vs_fitness/data/essential_genes.tsv |
| Specific phenotypes | Condition-specific fitness annotations | Fitness Browser specificphenotype table |
Generated Data
| File | Description |
|---|---|
data/fitness_stats.tsv | Per-gene fitness summary |
data/fitness_stats_by_condition.tsv | Per-gene per-condition-type stats |
data/specific_phenotypes.tsv | Specific phenotype counts |
References
- Price MN et al. (2018). “Mutant phenotypes for thousands of bacterial genes of unknown function.” Nature 557:503-509. PMID: 29769716
- Parks DH et al. (2022). “GTDB: an ongoing census of bacterial and archaeal diversity through a phylogenetically consistent, rank normalized and complete genome-based taxonomy.” Nucleic Acids Res 50:D199-D207. PMID: 34520557
- Luo H et al. (2015). “Evolution of divergent life history strategies in marine alphaproteobacteria.” mBio 6:e01251-15. PMID: 26530382
- McInerney JO et al. (2017). “Why prokaryotes have pangenomes.” Nat Microbiol 2:17040. PMID: 28350002
Supporting Evidence
| Type | Path | Description |
|---|---|---|
| Notebook | notebooks/02_fitness_vs_conservation.ipynb | Magnitude + novel gene landscape |
| Notebook | notebooks/03_breadth_vs_conservation.ipynb | Breadth + condition type analysis |
| Figure | figures/conservation_by_fitness_profile.png | Conservation by fitness profile |
| Figure | figures/fitness_magnitude_vs_conservation.png | Fitness magnitude vs conservation |
| Figure | figures/fitness_breadth_vs_conservation.png | Fitness breadth vs conservation |
| Figure | figures/broad_vs_specific_conservation.png | Broad vs specific conservation |
| Figure | figures/burden_genes_by_conservation.png | Burden genes by conservation |
| Figure | figures/cost_benefit_portrait.png | Cost-benefit portrait |
| Figure | figures/conservation_by_condition_type.png | Conservation by condition type |
| Figure | figures/fitness_distributions_by_conservation.png | Fitness distributions by conservation |
| Figure | figures/novel_gene_mean_fitness.png | Novel gene mean fitness |
| Data | data/fitness_stats.tsv | Per-gene fitness summary |
| Data | data/fitness_stats_by_condition.tsv | Per-gene per-condition-type stats |
| Data | data/specific_phenotypes.tsv | Specific phenotype counts |
Revision History
- v1 (2026-02): Migrated from README.md
- v2 (2026-02): Added inline figures, notebook provenance, Data section, Literature Context, Limitations, References