Key Findings
1. Environmental samples show 3.4x stronger geographic signal than human-associated samples
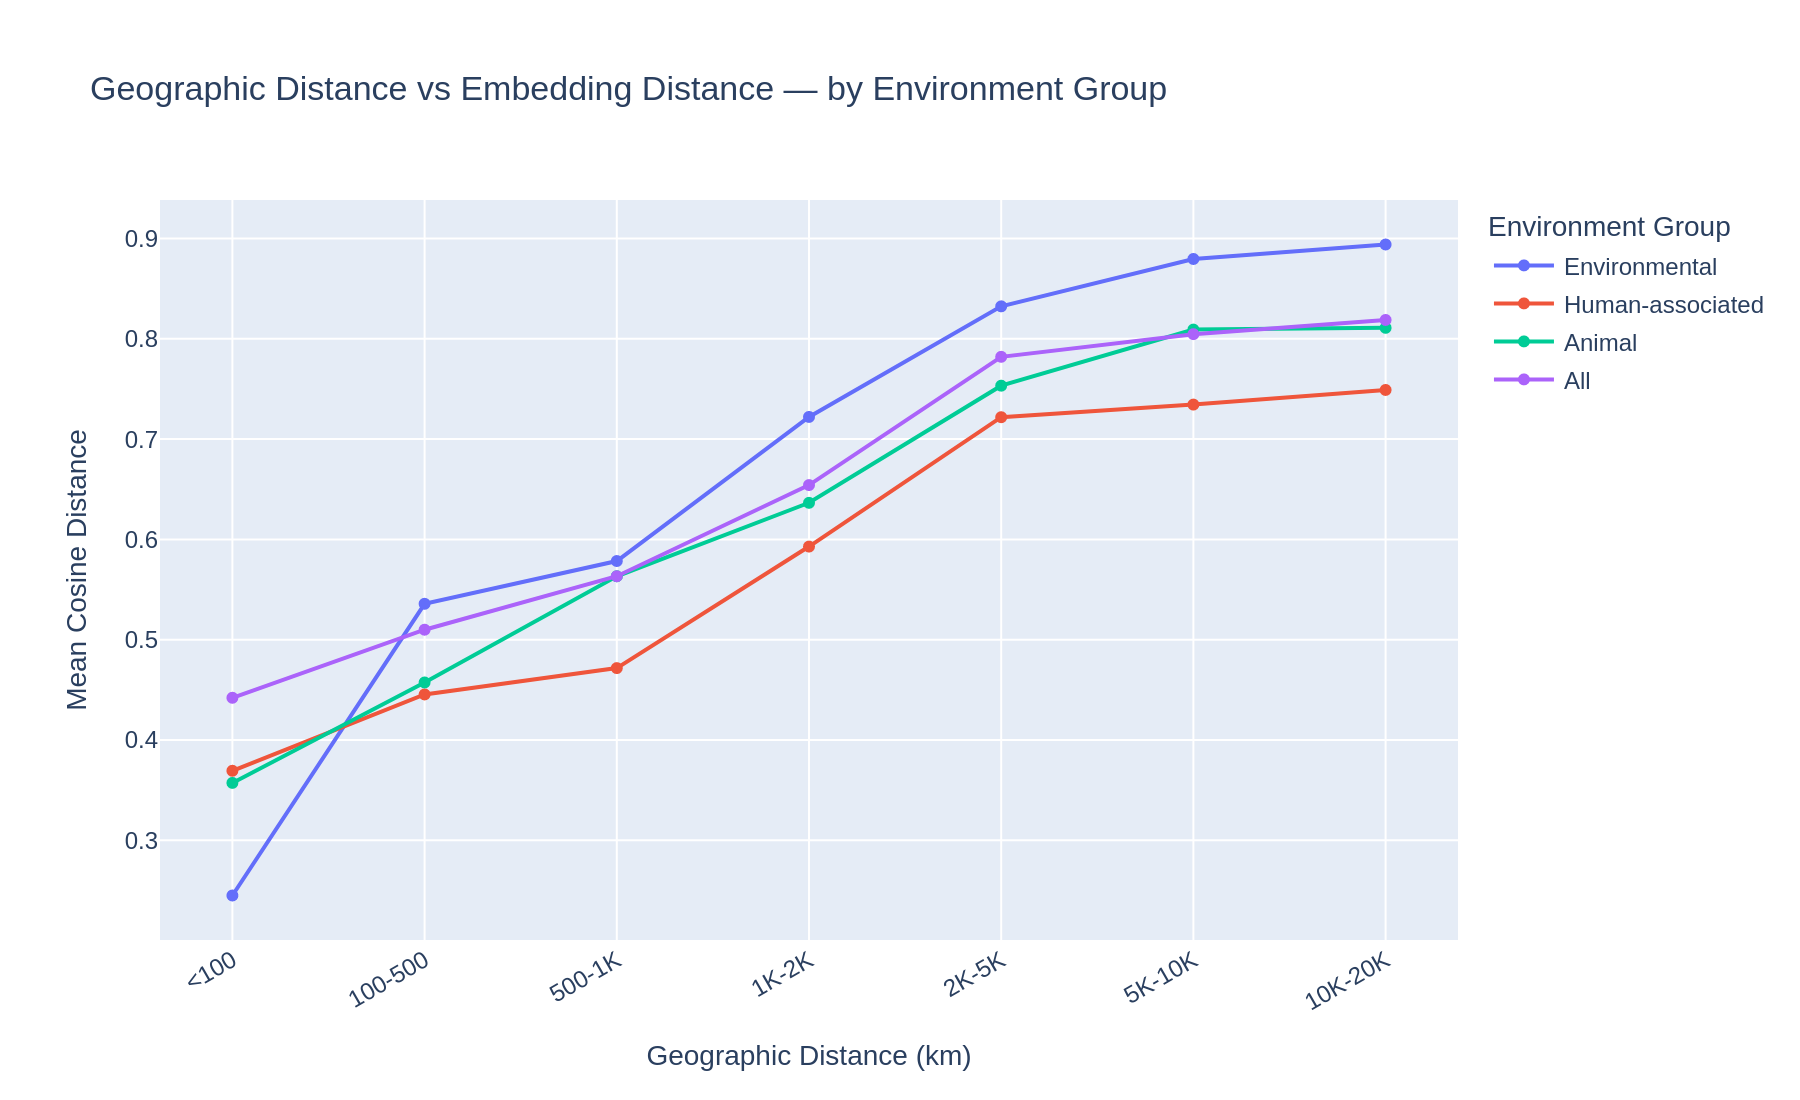
AlphaEarth embeddings encode geographic/environmental signal, but the strength depends on the sample source. For environmental samples (Soil, Marine, Freshwater, Extreme, Plant), nearby genomes (<100 km) have mean cosine distance 0.27, rising to 0.90 at intercontinental distances (>10,000 km) — a 3.4x ratio. For human-associated samples (gut, clinical, other), the gradient is flatter: 0.37 nearby to 0.75 far — only a 2.0x ratio.
This reflects the fact that hospitals and clinics worldwide share similar satellite imagery (urban built environment), so human-associated genomes have more homogeneous embeddings regardless of geography. Environmental samples, from genuinely diverse landscapes, show much stronger geographic differentiation. The pooled “All samples” curve (2.0x ratio) is a blend of these two signals, dominated by the 38% human-associated fraction.
(Notebook: 02_interactive_exploration.ipynb)
2. AlphaEarth embeddings encode real geographic signal — not noise
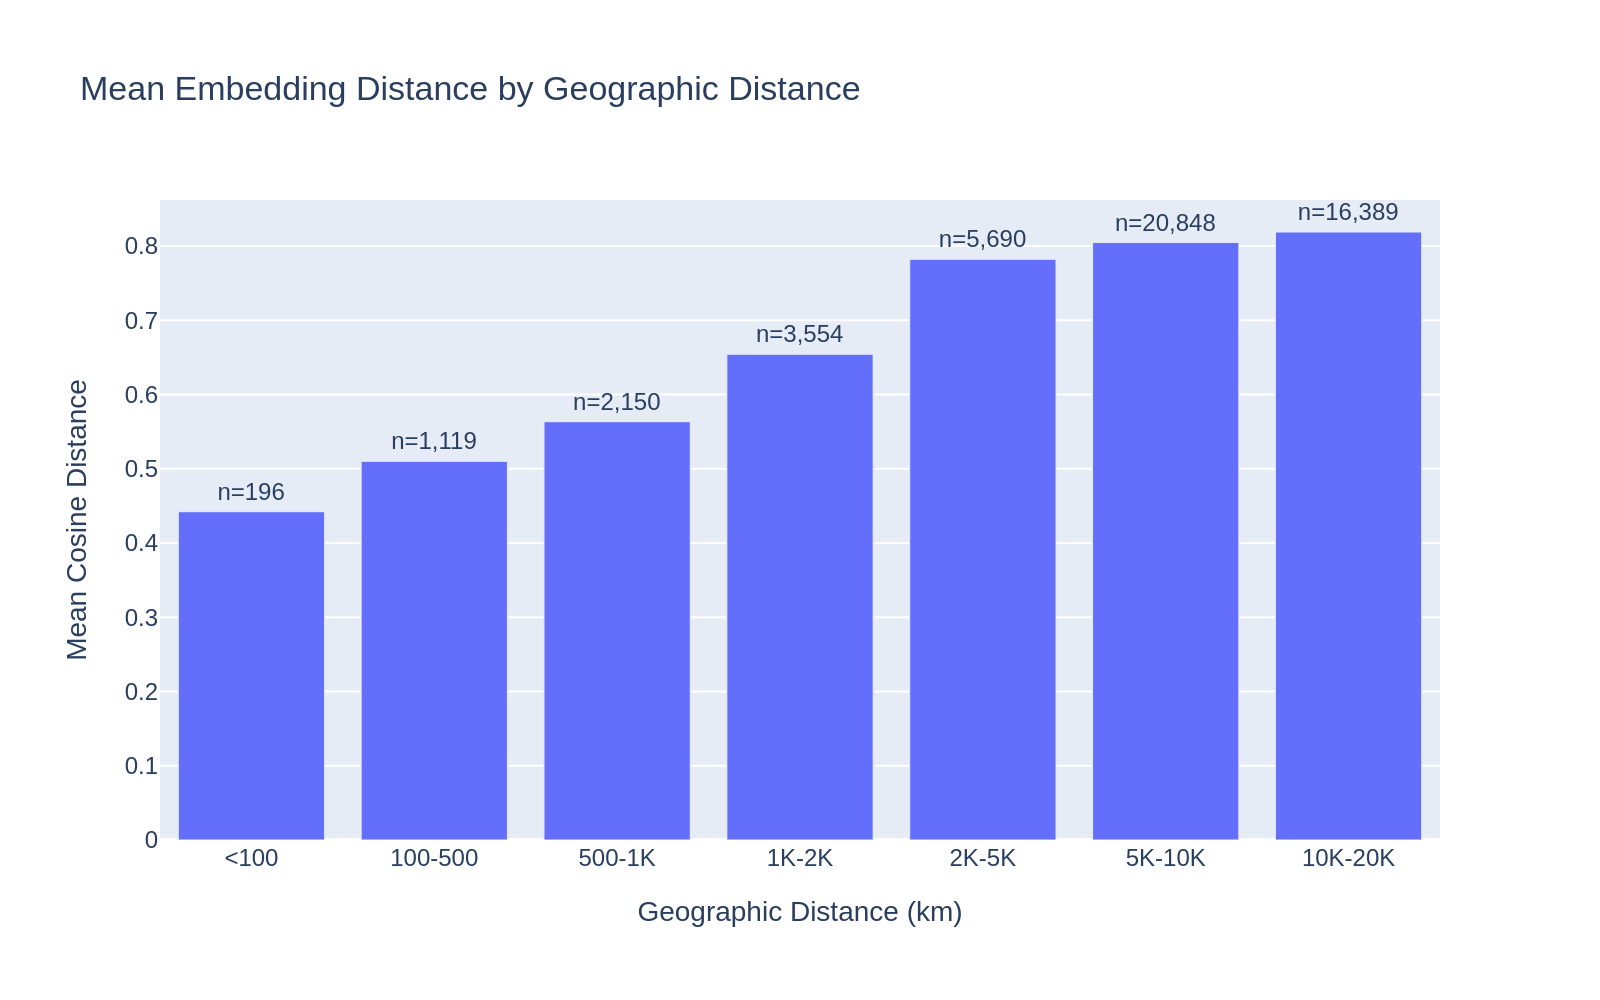
Across all 50,000 sampled genome pairs (using only good-quality coordinates), there is a clear monotonic relationship between geographic distance and embedding cosine distance. The relationship is strongest at short distances (<2,000 km) and plateaus at intercontinental scales (>5,000 km), suggesting the embeddings capture local environmental conditions (climate, vegetation, land use) that are spatially autocorrelated.
| Geographic Distance | Mean Cosine Distance | N pairs |
|---|---|---|
| <100 km | 0.41 | 231 |
| 100–500 km | 0.51 | 1,058 |
| 500–1K km | 0.56 | 2,016 |
| 1K–2K km | 0.66 | 3,779 |
| 2K–5K km | 0.78 | 5,824 |
| 5K–10K km | 0.80 | 20,935 |
| 10K–20K km | 0.82 | 16,107 |
(Notebook: 02_interactive_exploration.ipynb)
3. Strong clinical/human sampling bias in the AlphaEarth subset
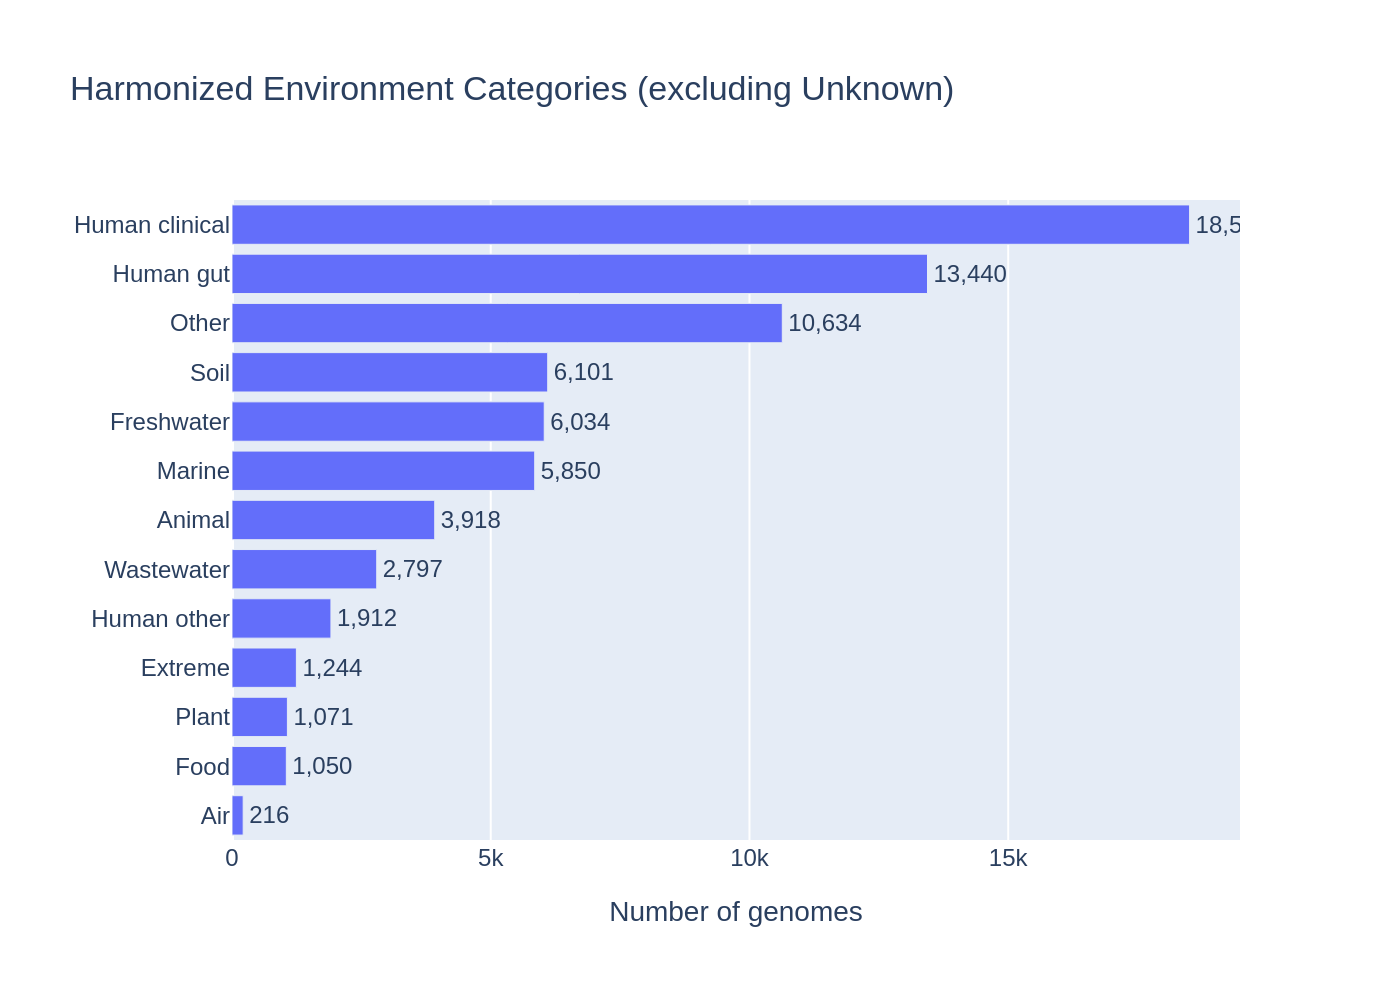
38% of the 83,287 genomes with AlphaEarth embeddings are human-associated: Human clinical (16,390; 20%), Human gut (13,466; 16%), and Human other (1,669; 2%). Environmental categories are much smaller: Soil (6,073; 7%), Marine (5,850; 7%), Freshwater (5,840; 7%). This reflects NCBI’s overall bias toward pathogen sequencing — clinical isolates tend to have good geographic metadata from epidemiological tracking, which is why they have AlphaEarth embeddings.
An additional 13,944 genomes (17%) were classified as “Other” — site-specific labels (e.g., “Aspo HRL”, “Olkiluoto” — underground research labs), generic terms (“water”, “bodily fluid”), and clinical sites not captured by current keywords.
(Notebook: 02_interactive_exploration.ipynb)
4. 36% of coordinates flagged as potential institutional addresses
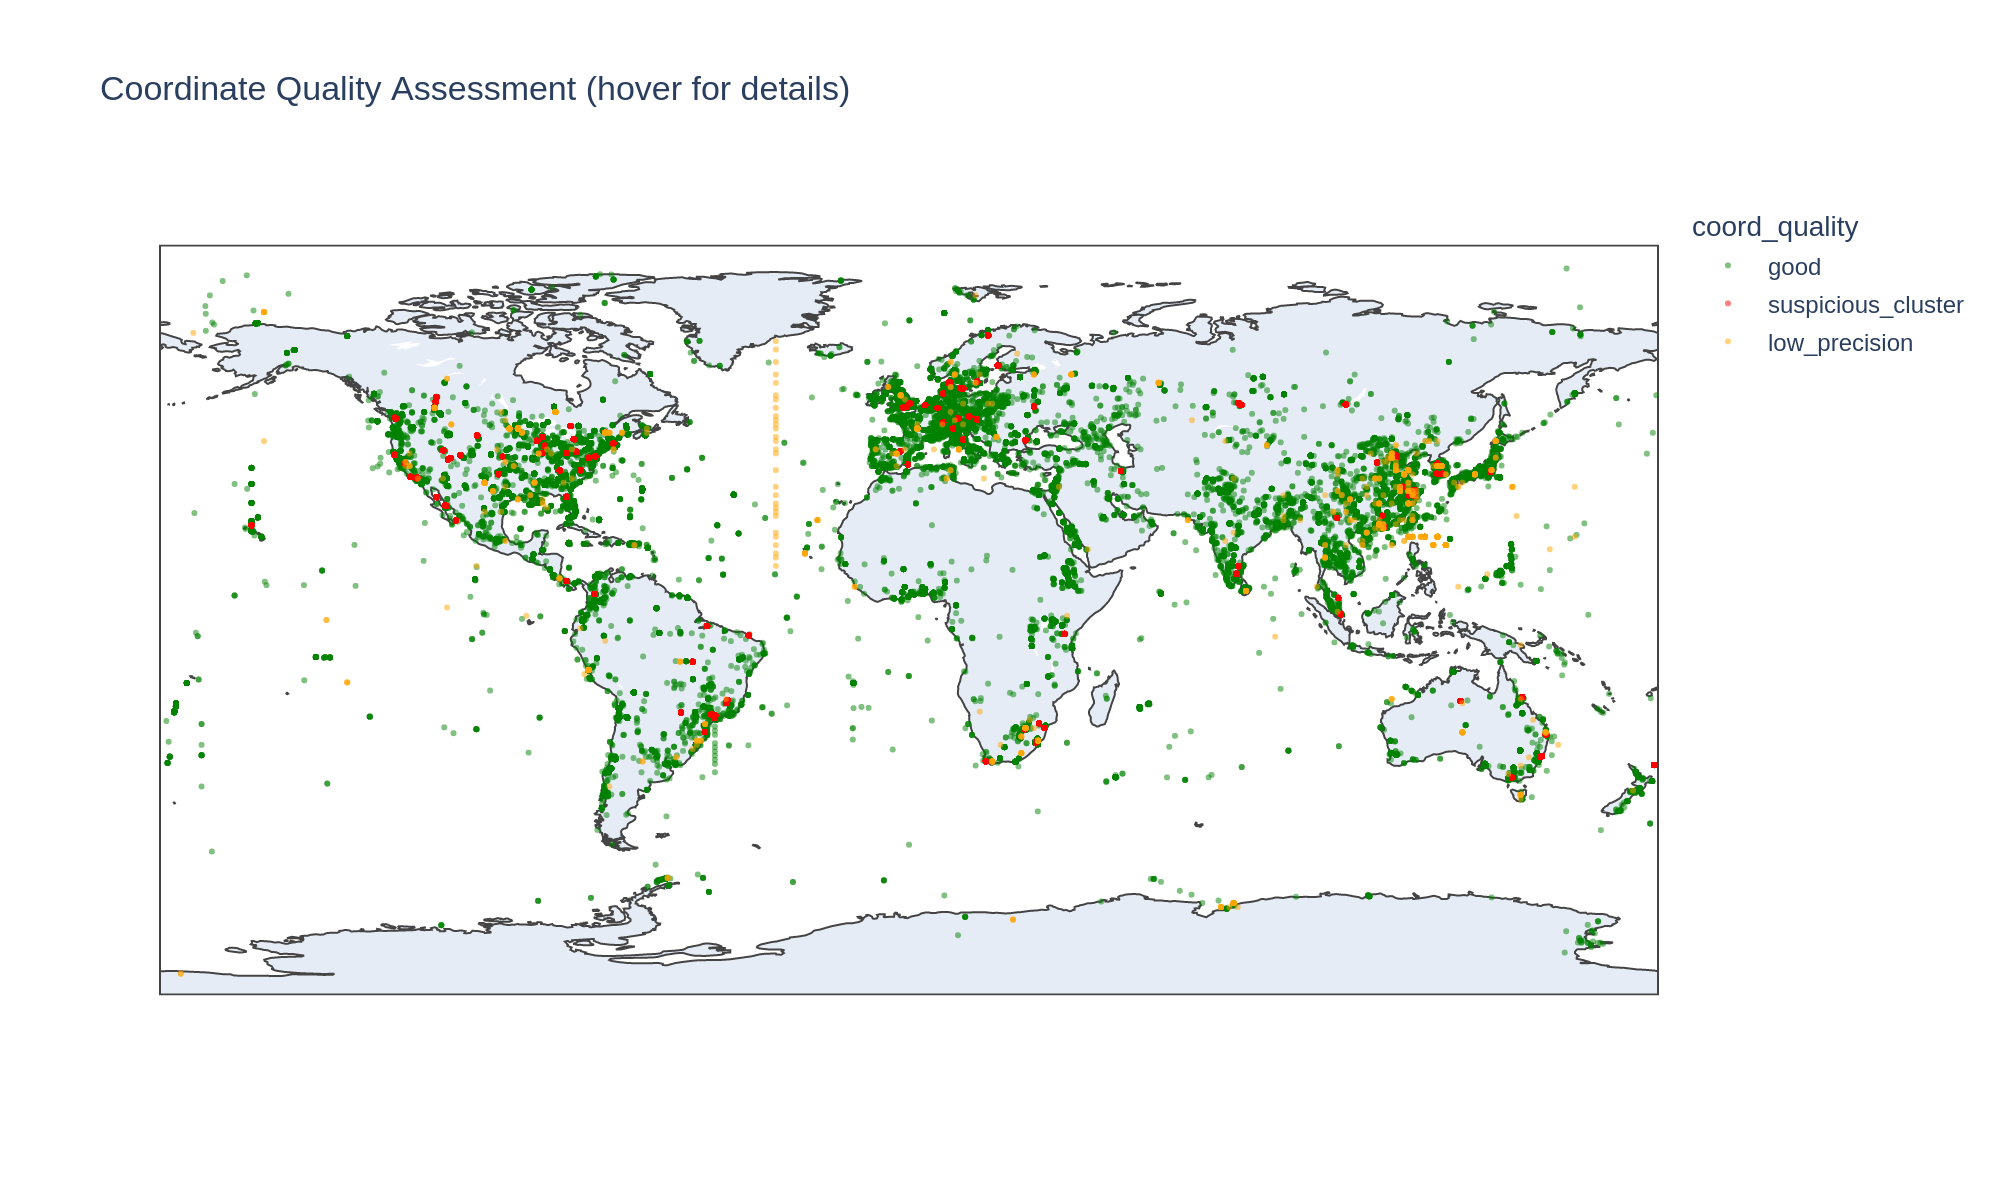
30,469 genomes (36.6%) cluster at shared coordinates with >50 genomes and >10 species — a heuristic for institutional addresses rather than sampling sites. However, several flagged locations are legitimate field research sites:
| Location | Coordinates | Genomes | Context |
|---|---|---|---|
| Rifle, CO | 39.54, -107.78 | 1,883 | DOE IFRC groundwater research site |
| Saanich Inlet, BC | 48.36, -123.30 | 1,529 | Oceanographic O2-minimum zone |
| Siberian soda lakes | 52.11, 79.17 | 812 | Extremophile sampling campaigns |
| Pittsburgh, PA | 40.44, -79.97 | 630 | Likely institutional (diverse clinical) |
| Lima, Peru | -12.0, -77.0 | 1,641 | Integer coords, likely approximate |
The current heuristic is a rough first pass. A refined approach should check whether genomes at each location have homogeneous isolation sources (real site) vs diverse unrelated sources (institutional).
(Notebook: 02_interactive_exploration.ipynb)
5. UMAP reveals fine-grained embedding structure with environment-correlated clusters
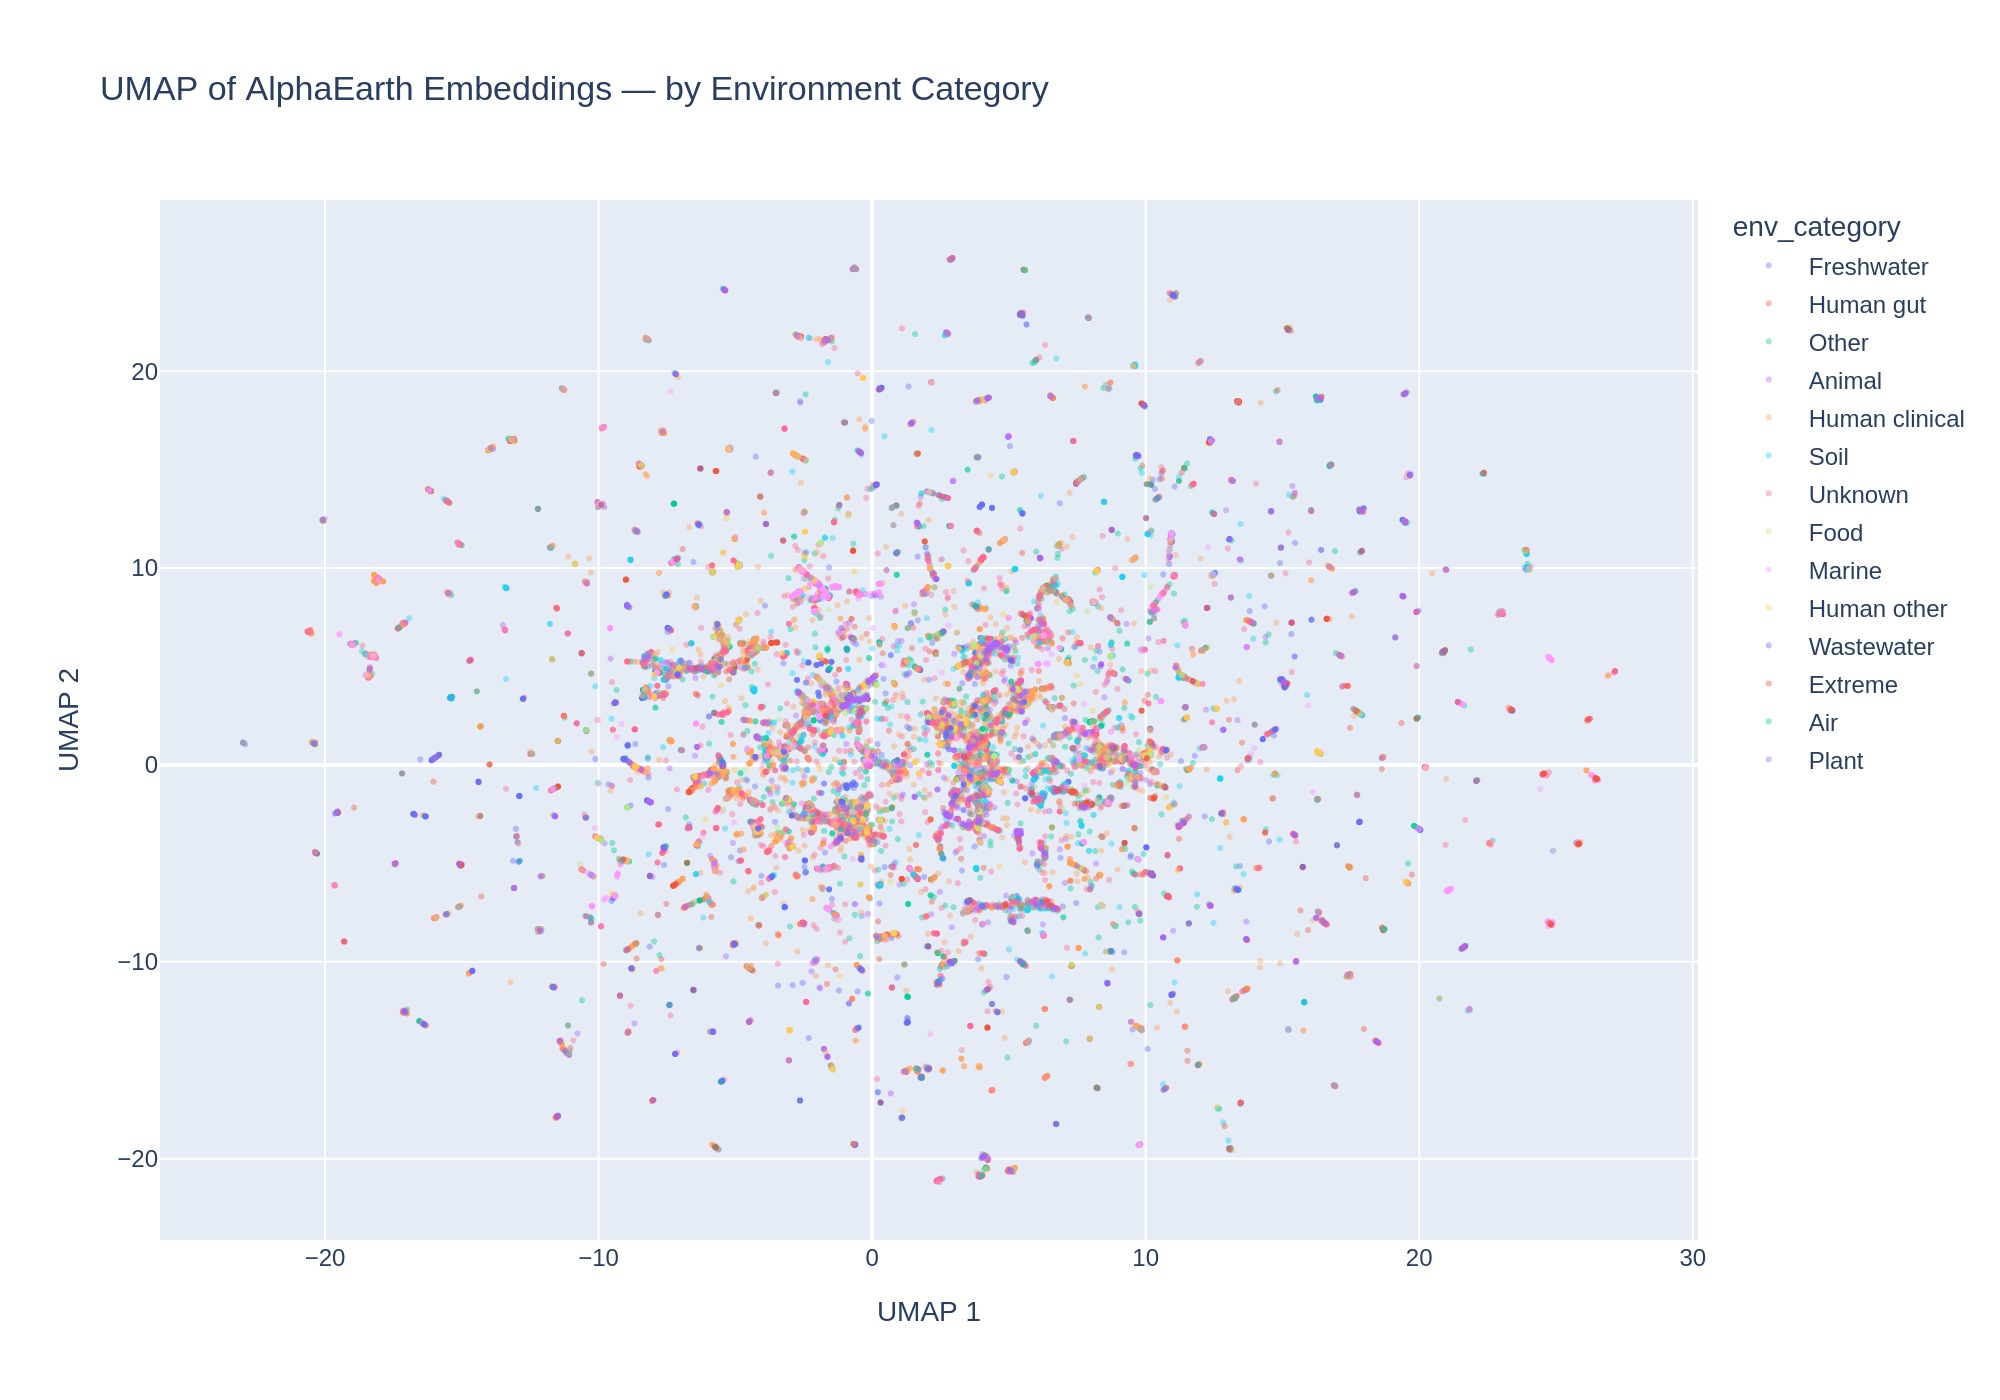
UMAP reduction of the 64-dimensional embeddings to 2D reveals substantial structure. DBSCAN clustering identified 320 clusters. The cluster–environment cross-tabulation shows that many clusters are dominated by a single environment category:
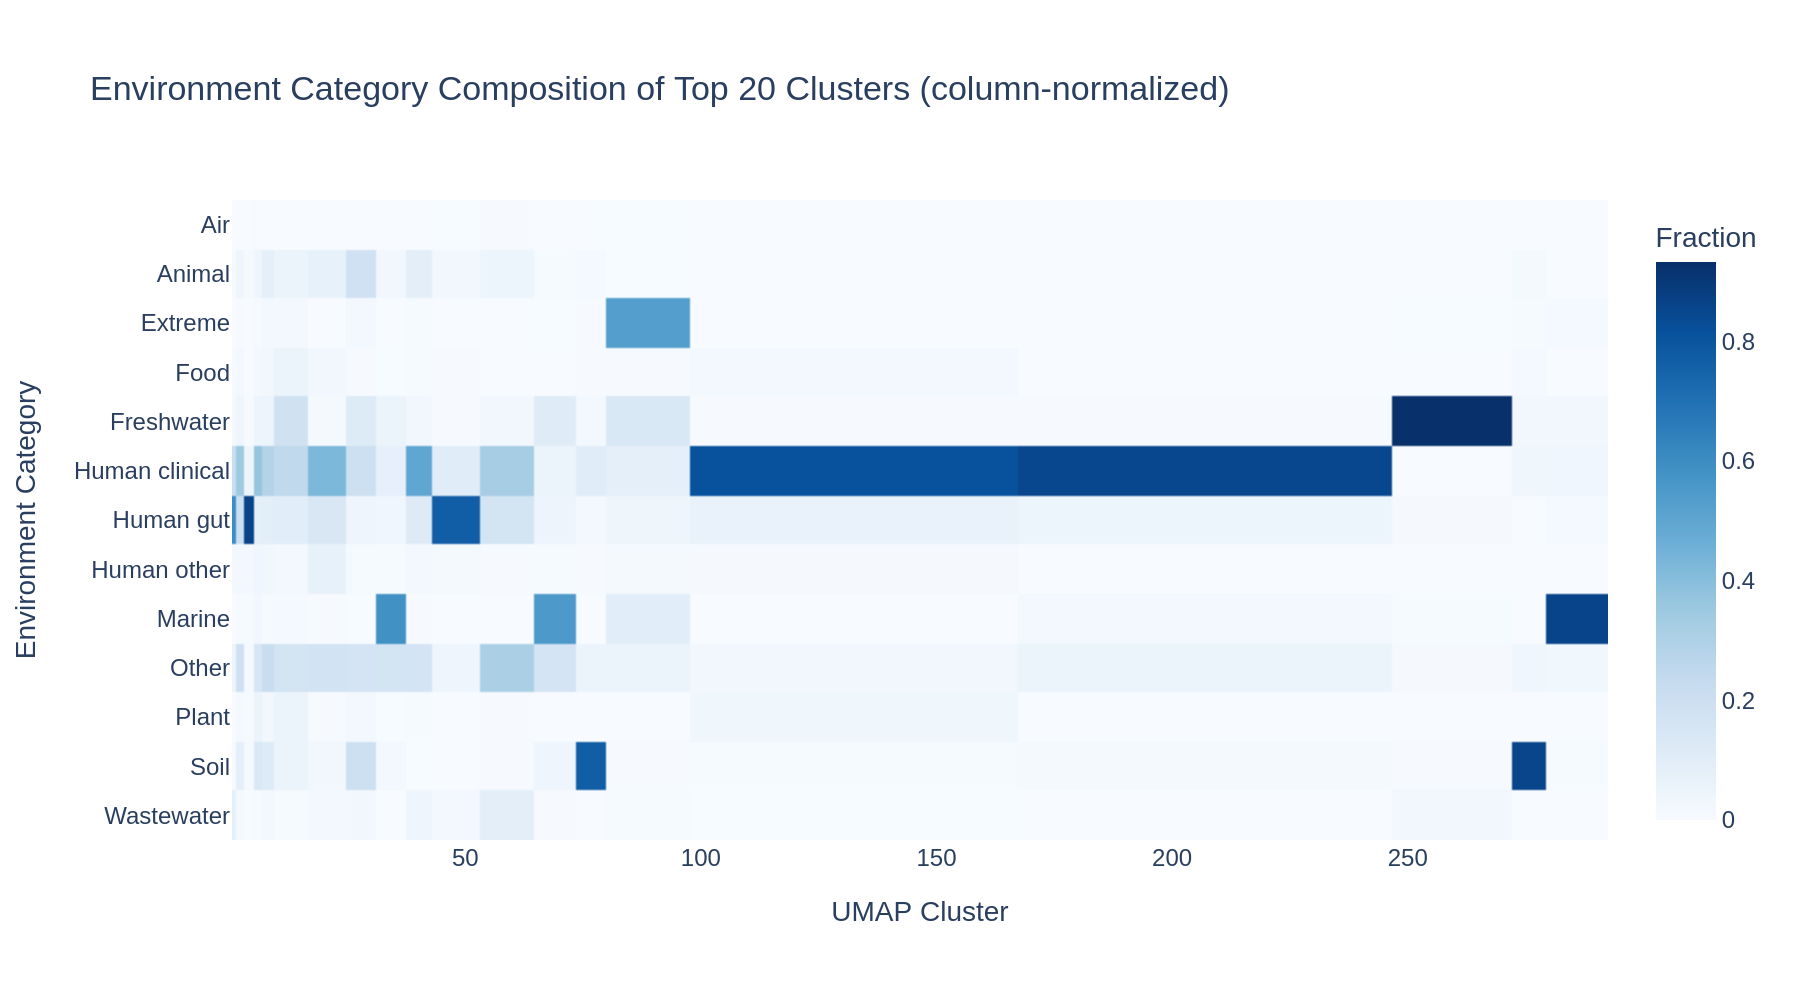
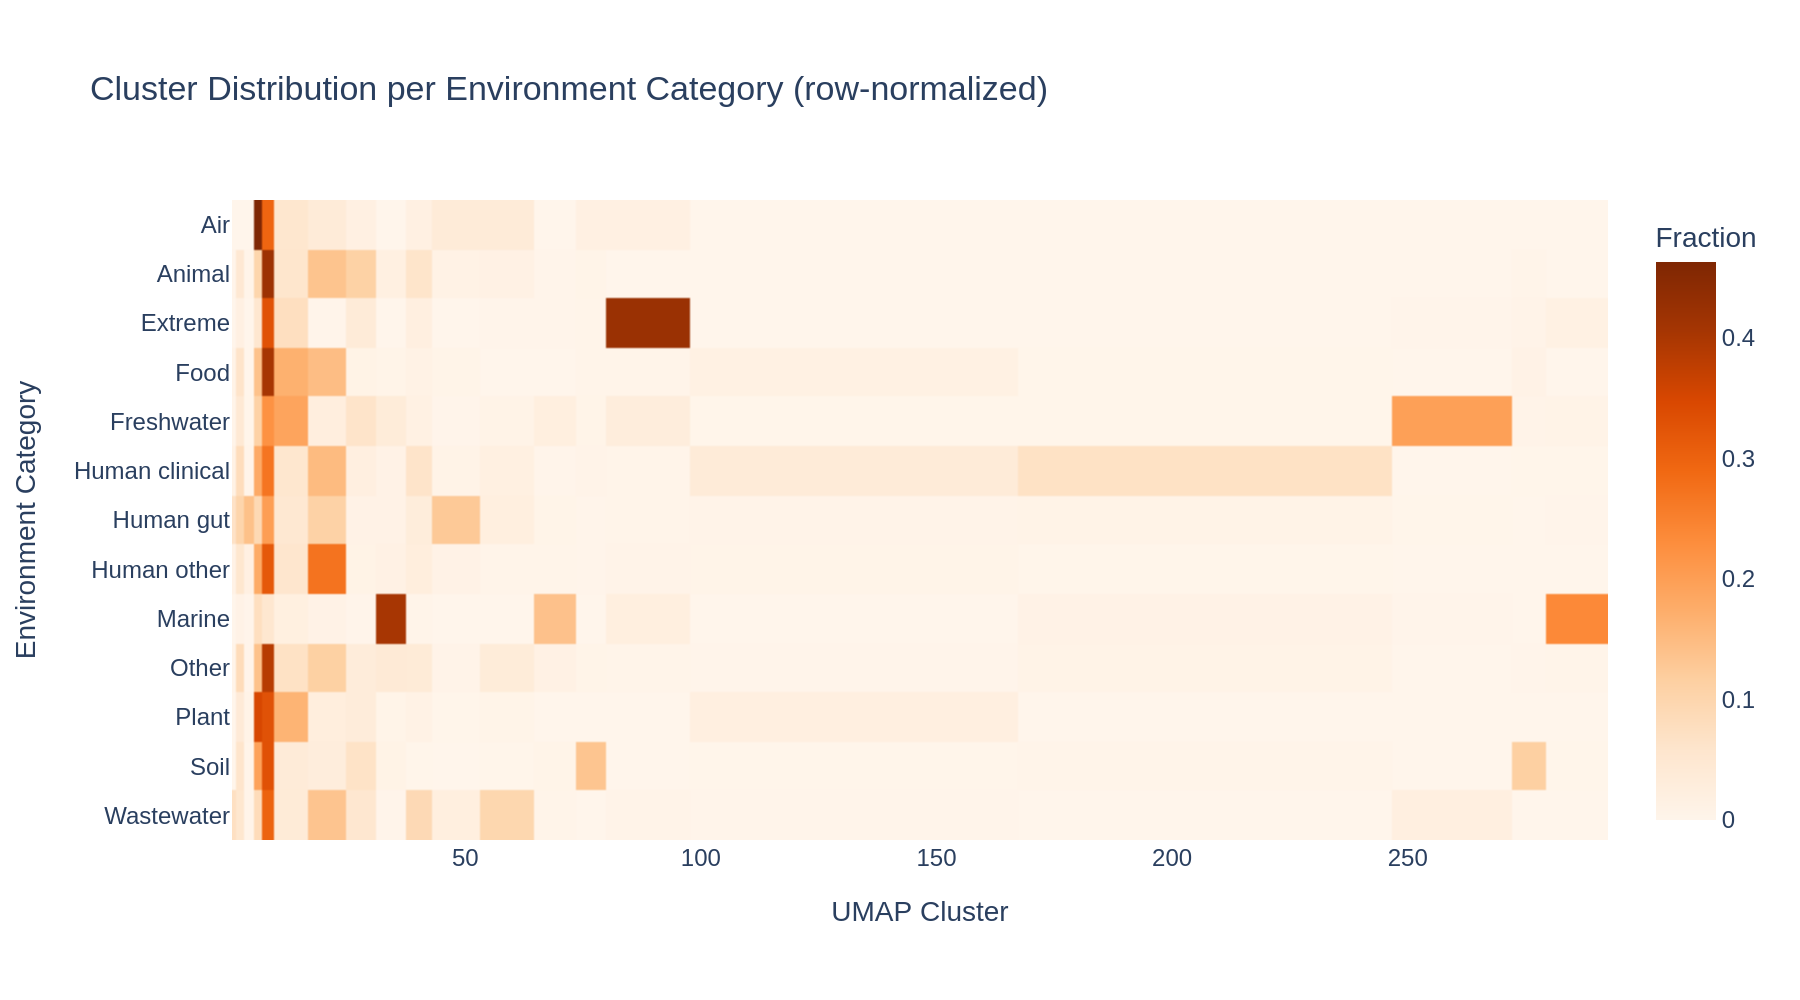
Rare environment types (Air, Extreme, Plant) concentrate in just a few specific clusters, while common categories (Human gut, Human clinical) are distributed across many clusters — likely reflecting geographic sub-structure within those categories.
(Notebook: 02_interactive_exploration.ipynb)
6. Embedding space also shows taxonomic structure
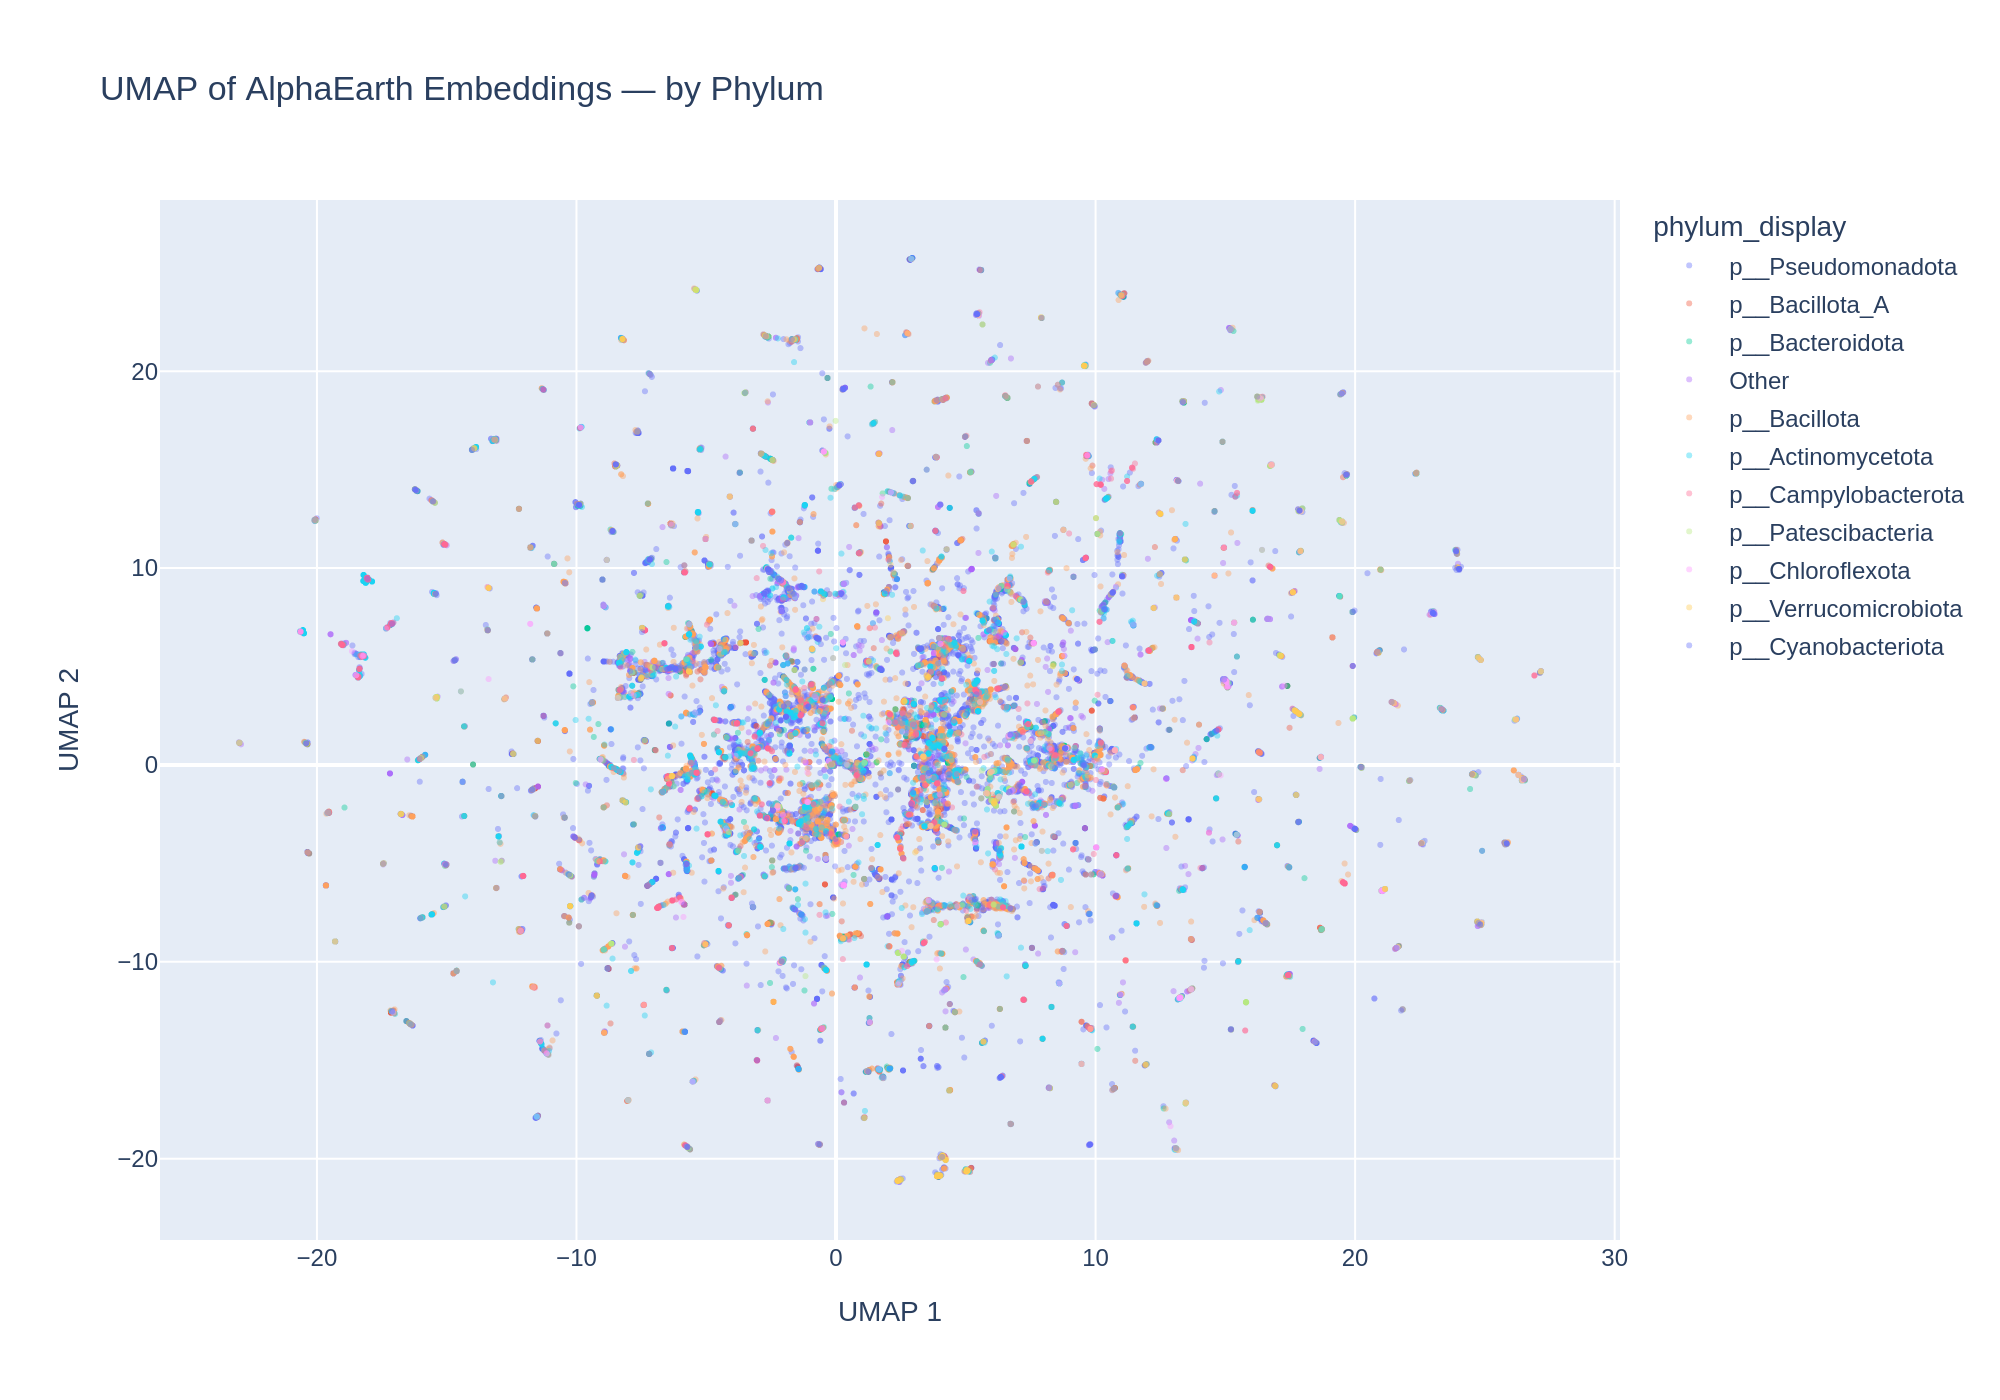
Coloring the UMAP by phylum reveals some taxonomic clustering, though this is partially confounded with environment (e.g., Campylobacterota are predominantly gut-associated). The interactive HTML version (figures/umap_by_phylum.html) allows toggling phyla on/off to explore this structure.
(Notebook: 02_interactive_exploration.ipynb)
Results
Data coverage
The AlphaEarth embeddings table covers 83,287 genomes (28.4% of 293,059 total in the pangenome database). Of these, 79,449 have valid (non-NaN) embeddings across all 64 dimensions; 3,838 have NaN in at least one dimension.
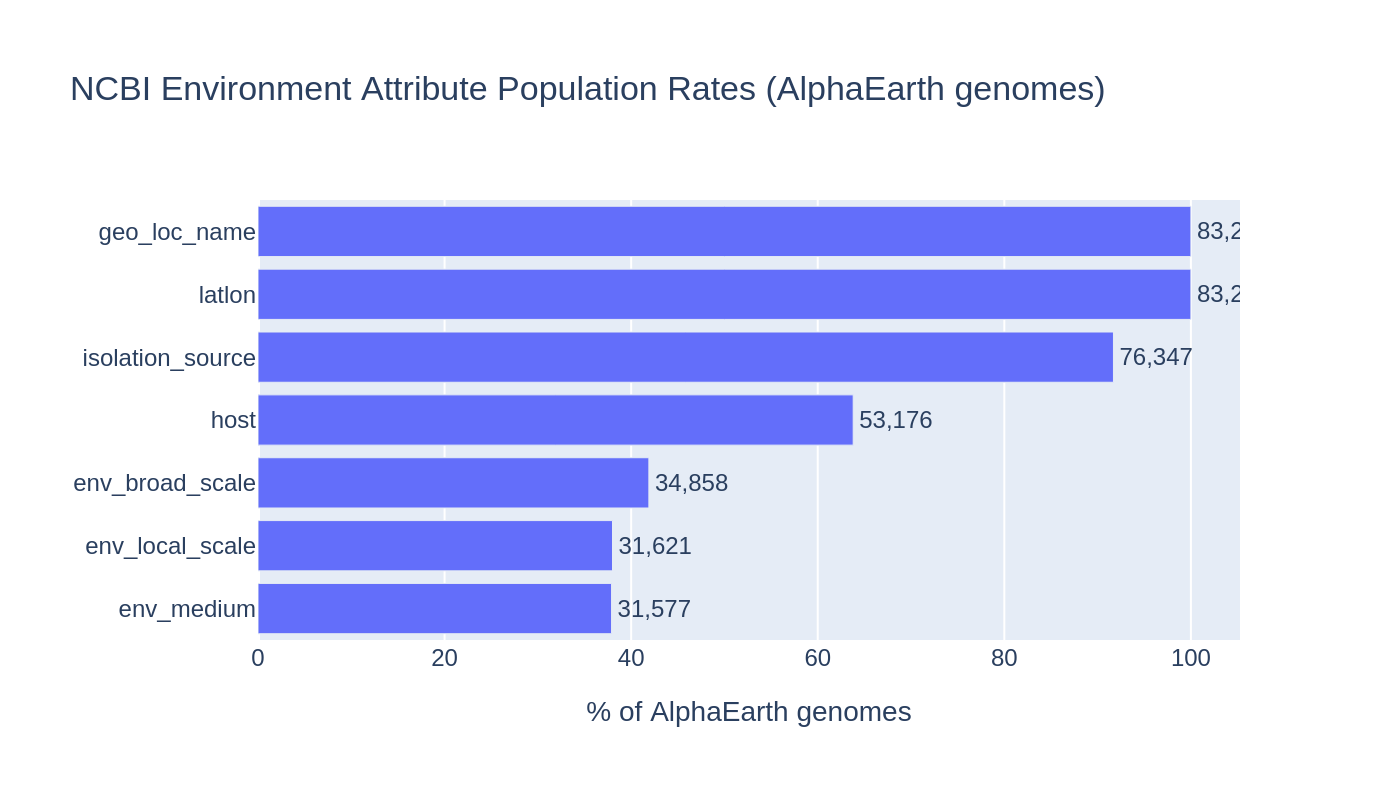
Metadata coverage among the 83,287 AlphaEarth genomes:
| Attribute | N genomes | % |
|---|---|---|
| Lat/lon (cleaned) | 83,286 | 100.0% |
| geo_loc_name | 83,270 | 100.0% |
| isolation_source | 76,295 | 91.6% |
| host | 53,091 | 63.7% |
| env_broad_scale | 34,800 | 41.8% |
| env_local_scale | 31,541 | 37.9% |
| env_medium | 31,483 | 37.8% |
The NCBI ncbi_env table contains 334 distinct harmonized attribute names across 4.1M rows. The most populated are collection_date (273K genomes), geo_loc_name (272K), and isolation_source (245K).
Environment harmonization
5,774 unique isolation_source free-text values were mapped to 12 broad categories via keyword matching. The mapping captures 71% of genomes with a label; 17% remain as “Other” and 12.5% are “Unknown” (missing/null isolation_source).
The env_broad_scale ENVO ontology field is cleaner but covers only 42% of genomes. Many values are bare ENVO IDs without labels (e.g., “ENVO:00000428”) or generic terms (“not applicable”, “missing”). Where available, structured ENVO terms like “marine biome [ENVO:00000447]” provide standardized categories.
Coordinate quality
11,765 unique coordinate locations across 83,286 genomes with lat/lon. Quality breakdown:
| Quality | Genomes | % |
|---|---|---|
| Good | 50,109 | 60.2% |
| Suspicious cluster | 30,469 | 36.6% |
| Low precision (integer degrees) | 2,708 | 3.3% |
Embedding properties
The 64 embedding dimensions (A00–A63) have values in [-0.544, 0.544], mean near zero (-0.008), mean standard deviation 0.109. The embeddings span 135 phyla, 15,046 species, and the full global extent (latitude -85 to +84, longitude -178 to +180).
Interpretation
What do AlphaEarth embeddings represent?
The embeddings encode geographic/environmental context derived from satellite imagery at each genome’s sampling location. The strong geographic distance–embedding distance correlation (Finding 2) confirms they capture spatially varying environmental features — likely climate, land use, vegetation type, and urban/rural character.
The stratified analysis (Finding 1) reveals that the signal is primarily driven by variation in natural environments, not urban settings. Hospitals worldwide look similar from satellite; forests, oceans, and deserts do not. This has practical implications: the embeddings are most informative for environmental microbiology samples and least informative for clinical isolates.
Implications for downstream analysis
The ecotype_analysis project previously found that AlphaEarth-based environment similarity was a weak predictor of gene content (median partial correlation 0.0025). The strong clinical bias identified here may partially explain that weak signal — if 38% of the genomes being compared are from interchangeable hospital environments, the environment–gene content relationship would be diluted. Repeating the ecotype analysis restricted to environmental samples could reveal a stronger signal.
Literature Context
The geographic distance–embedding distance relationship we observe (Finding 2) is a form of distance-decay, a fundamental pattern in biogeography where community similarity decreases with geographic distance. This pattern is well-established in microbial ecology:
- Pearman et al. (2024) found that macroalgal microbiome composition responds primarily to environmental variation rather than geographic separation, supporting the “everything is everywhere, the environment selects” principle. Our stratified analysis (Finding 1) is consistent: the embeddings — which encode environmental conditions — show stronger distance-decay for environmental samples than for human-associated ones.
- Liu et al. (2022) showed that in mining soils, metal contamination explained more variation in fungal community structure (4.16%) than geographic distance (1.21%). Similarly, our data suggests the embeddings capture environmental features (land use, vegetation) more than raw distance, as evidenced by the plateau above ~5,000 km.
- Zhang et al. (2022) found that rare and abundant bacterial subcommunities show similar distance-decay patterns but differ mechanistically. Our finding that human-associated samples show weaker distance-decay echoes the idea that dispersal limitation (relevant for environmental microbes) generates stronger geographic patterns than deterministic selection alone.
- Wang et al. (2024) demonstrated that aridity shapes distinct biogeographic patterns for soil bacteria, with higher similarity-distance decay rates across environmental gradients. This supports our interpretation that the AlphaEarth embeddings capture environmentally-driven variation.
The clinical sampling bias we identified (Finding 3) is a known issue in genomic databases but has not been quantified in the specific context of satellite-derived environmental embeddings. Public genome databases are heavily skewed toward pathogens and clinical isolates (Saha et al., 2023), which biases any analysis of environment-genome relationships.
Novel Contribution
This is the first systematic characterization of the AlphaEarth embedding space in BERDL. Key novel contributions:
- Quantification of the geographic signal strength (3.4x for environmental, 2.0x for human-associated)
- Identification of the clinical sampling bias and its impact on embedding-based analyses
- A coordinate QC framework (with known limitations) for flagging institutional addresses
- A reusable environment harmonization mapping (12 categories from 5,774 free-text values)
Limitations
- AlphaEarth coverage is only 28.4% of all genomes — biased toward those with valid lat/lon metadata
- Clinical/human bias (38%) may not represent the overall NCBI or pangenome population
- Coordinate QC heuristic is crude — flags some legitimate field sites (Rifle, Saanich Inlet); needs refinement using isolation_source homogeneity
- Environment harmonization has a long tail — 17% “Other” category; keyword matching doesn’t capture site-specific labels or non-English terms
- UMAP is a non-linear projection — cluster structure depends on parameters (n_neighbors, min_dist) and may not reflect true high-dimensional topology
- Embedding NaN values (4.6%) — cause unknown; possibly missing satellite imagery at those coordinates
- DBSCAN eps=0.5 produced 320 clusters — likely too fine-grained; coarser clustering may better match environment categories
Data
Sources
| Collection | Tables Used | Purpose |
|---|---|---|
kbase_ke_pangenome | alphaearth_embeddings_all_years | 64-dim environmental embeddings, cleaned lat/lon, taxonomy |
kbase_ke_pangenome | ncbi_env | NCBI environment metadata (EAV format) |
Generated Data
| File | Rows | Description |
|---|---|---|
data/alphaearth_with_env.csv | 83,287 | Merged embeddings + pivoted environment labels |
data/coverage_stats.csv | 7 | Per-attribute population rates |
data/ncbi_env_attribute_counts.csv | 334 | Full inventory of harmonized_name values |
data/isolation_source_raw_counts.csv | 5,774 | Raw isolation_source value frequencies |
data/umap_coords.csv | 79,449 | Pre-computed UMAP 2D coordinates |
Supporting Evidence
Notebooks
| Notebook | Purpose |
|---|---|
01_data_extraction.ipynb | Spark extraction of AlphaEarth embeddings + NCBI env pivot (JupyterHub) |
02_interactive_exploration.ipynb | Coverage, coord QC, harmonization, UMAP, maps, distance analysis (local/JupyterHub) |
Figures
| Figure | Description |
|---|---|
coverage_bar.png | Attribute population rates across AlphaEarth genomes |
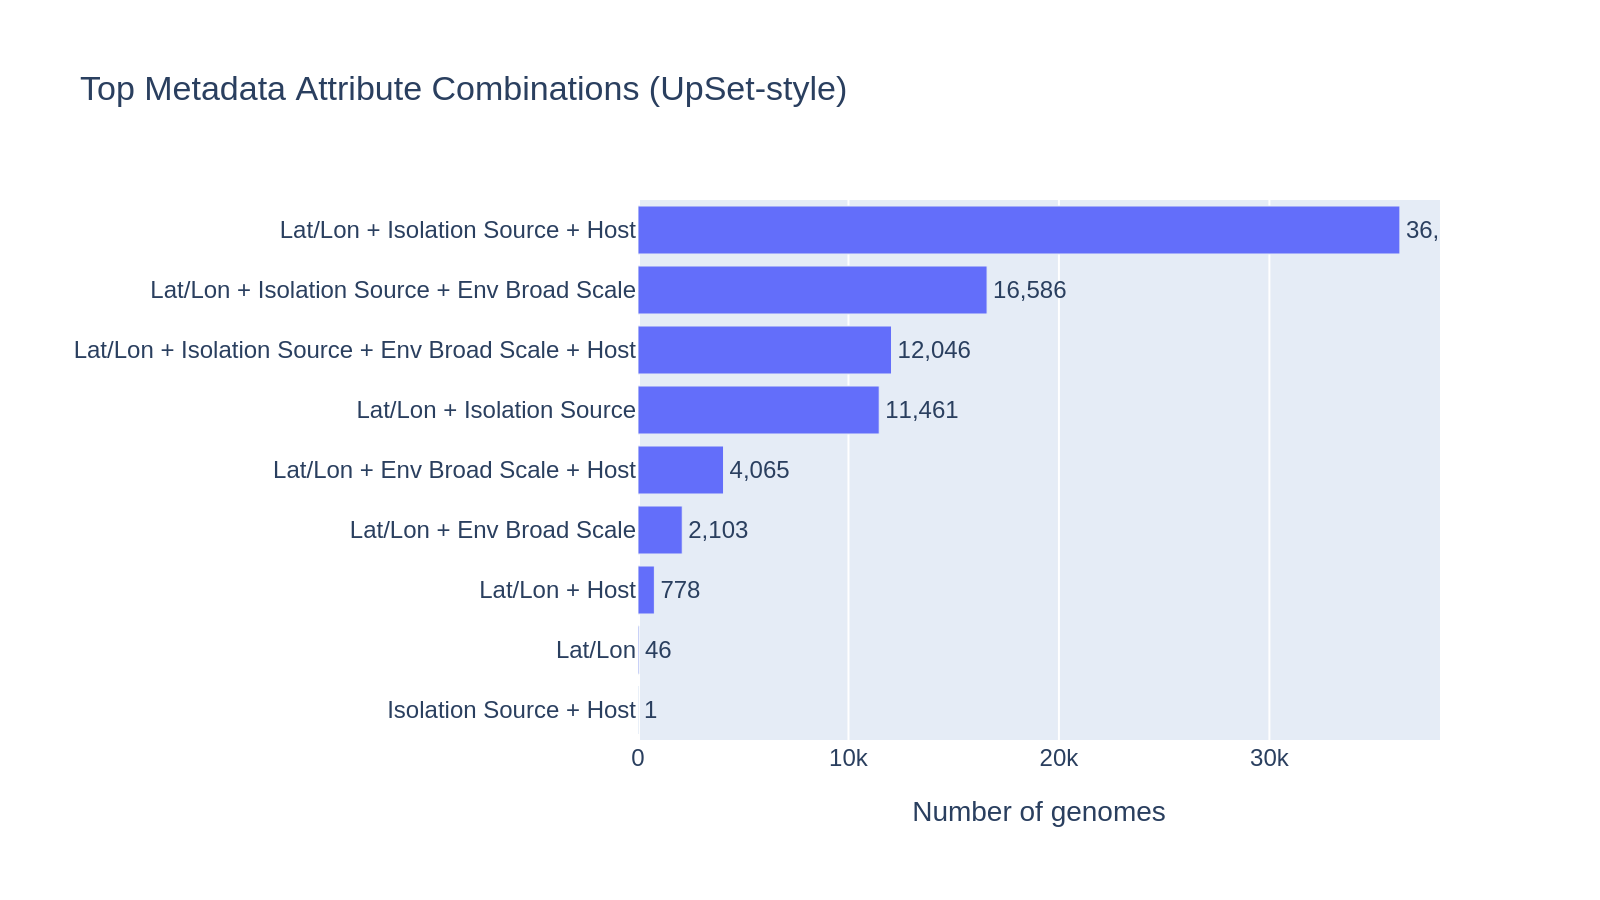
coverage_intersections.png | UpSet-style intersection of metadata attribute combinations |
coord_quality_map.png | Global map with coordinate quality flags (good/suspicious/low precision) |
env_categories.png | Harmonized environment category frequencies |
umap_by_env_category.png | UMAP of embeddings colored by harmonized environment category |
umap_by_phylum.png | UMAP colored by phylum (top 10 + Other) |
umap_by_coord_quality.png | UMAP colored by coordinate quality flag |
umap_clusters.png | DBSCAN clusters in UMAP space |
cluster_env_heatmap.png | Environment category composition of top 20 UMAP clusters |
env_cluster_distribution.png | Cluster distribution per environment category |
geo_vs_embedding_distance.png | Scatter of geographic vs embedding distance (10K sample) |
geo_vs_embedding_binned.png | Mean embedding distance by geographic distance bin |
geo_vs_embedding_by_env_group.png | Stratified distance curves: environmental vs human-associated vs animal |
Future Directions
- Refine coordinate QC: Use isolation_source homogeneity at each location to distinguish field sites from institutional addresses, rather than raw genome/species counts
- Reduce “Other” category: Add keywords for clinical body sites (cerebrospinal fluid, lung, throat), underground labs (Aspo, Olkiluoto), and generic water sources; use
env_broad_scaleas fallback whenisolation_sourceis ambiguous - Re-run ecotype analysis with environmental-only samples: The previous finding that phylogeny dominates over environment (ecotype_analysis project) may be stronger when restricted to environmental samples where the embeddings carry more geographic signal
- Investigate individual embedding dimensions: Correlate A00–A63 with latitude, temperature, precipitation, NDVI, or land cover classifications to understand what each dimension encodes
- Cross-validate with ENVO ontology: For the 42% of genomes with
env_broad_scale, compare ENVO-based classification with keyword-based harmonization to assess accuracy - Test embedding utility for gene content prediction: Do environmental samples with similar embeddings share more accessory genes, even after controlling for phylogeny?
References
- Parks, D.H. et al. (2022). “GTDB: an ongoing census of bacterial and archaeal diversity through a phylogenetically consistent, rank normalized and complete genome-based taxonomy.” Nucleic Acids Research, 50(D1), D199–D207. PMID: 34520557
- Pearman, W.S. et al. (2024). “Macroalgal microbiome biogeography is shaped by environmental drivers rather than geographical distance.” Annals of Botany. PMID: 37804485
- Liu, B. et al. (2022). “Disentangling biogeographic and underlying assembly patterns of fungal communities in metalliferous mining and smelting soils.” Science of the Total Environment. PMID: 35798111
- Zhang, S. et al. (2022). “Biogeographic Patterns and Elevational Differentiation of Sedimentary Bacterial Communities across River Systems in China.” Applied and Environmental Microbiology. PMID: 35638840
- Wang, X. et al. (2024). “Aridity shapes distinct biogeographic and assembly patterns of forest soil bacterial and fungal communities at the regional scale.” Science of the Total Environment. PMID: 39019268
- Dehal, P.S. et al. (2026). “Ecotype Correlation Analysis.” BERIL Research Observatory,
projects/ecotype_analysis/