Key Findings
Pairwise Co-fitness Weakly Predicts Co-occurrence
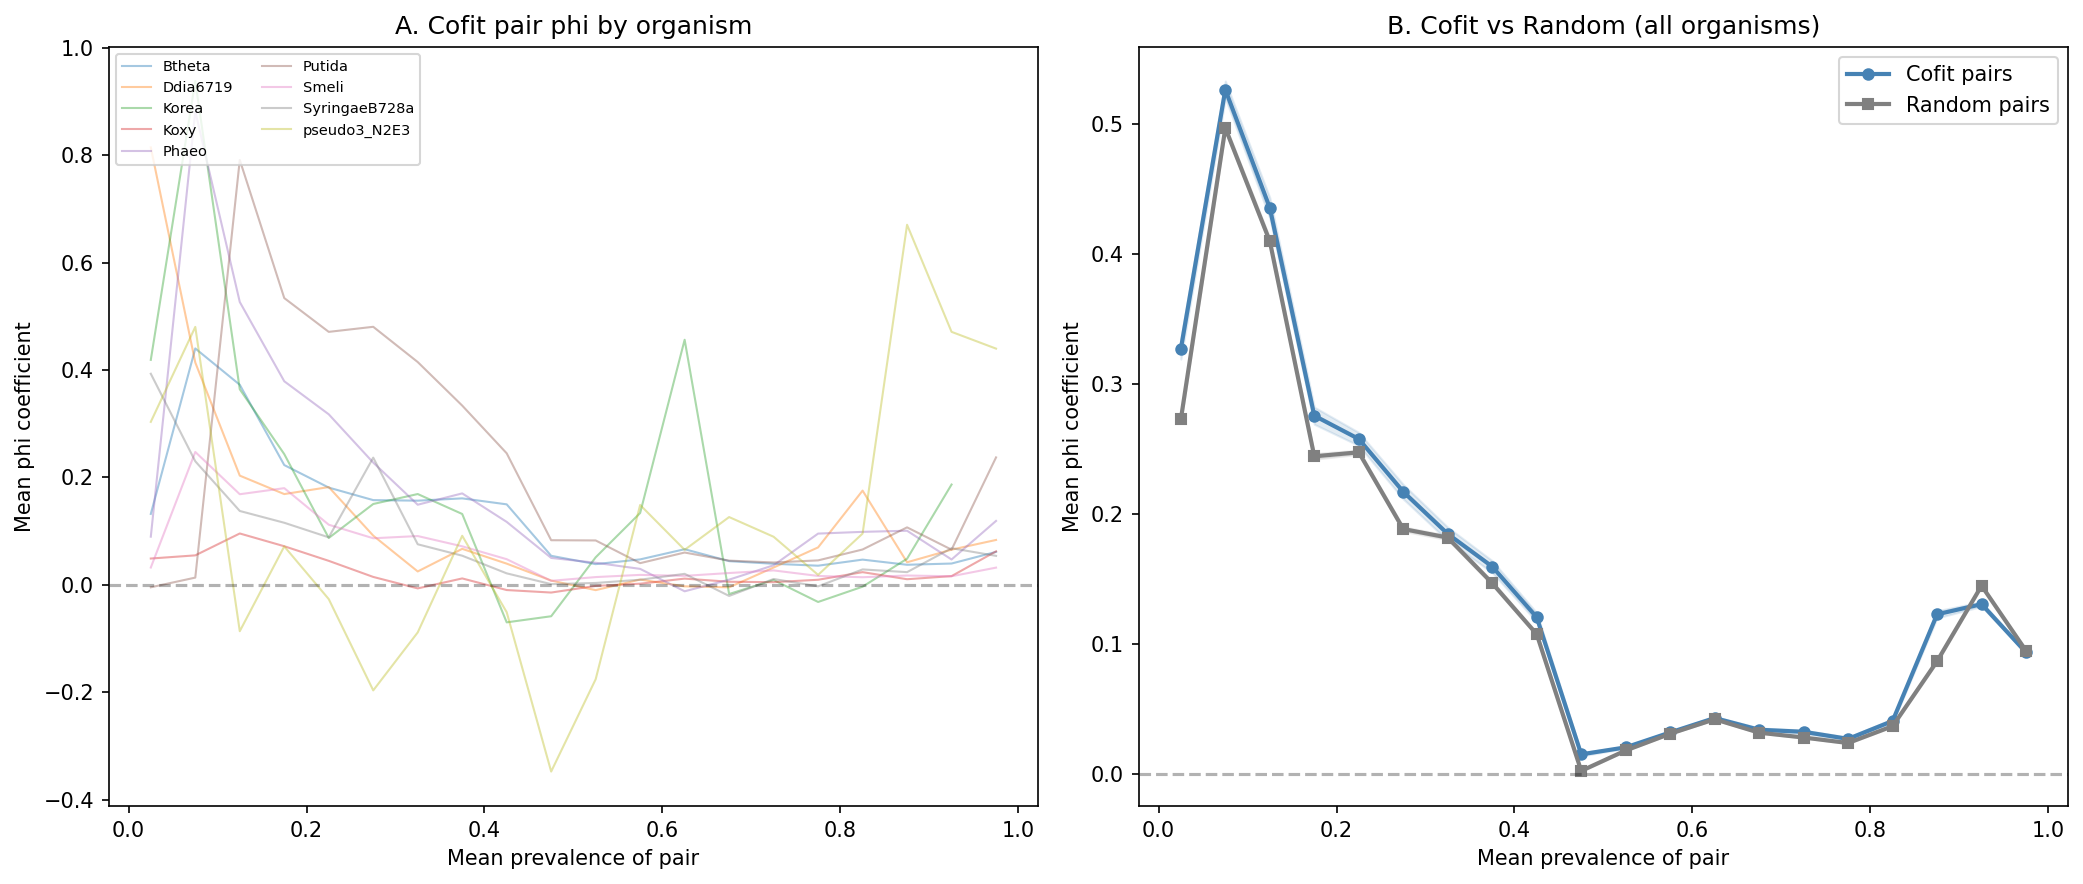
Across 9 organisms with co-fitness data (2.25M cofit pairs vs 22.5M prevalence-matched random pairs), co-fit gene pairs show a weak but consistent positive co-occurrence signal. The mean delta phi (cofit - random) is +0.011 across organisms, with 7 of 9 organisms showing a positive effect and 8 of 9 significant at p<0.05 (Mann-Whitney two-sided). However, the overall effect size is small (aggregate delta = +0.003, Mann-Whitney p=1.66e-29) and the Wilcoxon signed-rank test across organisms is not significant (W=9, p=0.13), reflecting high inter-organism variance.
| Organism | n cofit | Mean phi (cofit) | Mean phi (random) | Delta | p-value (two-sided) |
|---|---|---|---|---|---|
| Ddia6719 | 16,957 | 0.182 | 0.089 | +0.093 | <1e-300 |
| pseudo3_N2E3 | 31,959 | 0.458 | 0.433 | +0.026 | 6.6e-16 |
| Phaeo | 14,728 | 0.231 | 0.222 | +0.009 | 6.5e-4 |
| SyringaeB728a | 129,385 | 0.049 | 0.043 | +0.006 | 2.9e-4 |
| Koxy | 162,160 | 0.041 | 0.038 | +0.003 | 3.3e-2 |
| Smeli | 230,516 | 0.029 | 0.026 | +0.002 | <1e-17 |
| Btheta | 242,676 | 0.067 | 0.067 | +0.001 | <1e-6 |
| Putida | 205,323 | 0.171 | 0.171 | -0.000 | 0.41 |
| Korea | 7,994 | 0.447 | 0.489 | -0.042 | <1e-6 |
The signal is strongest in Ddia6719 (delta=+0.093), which despite being near-clonal (ANI 99.47%) has sufficient accessory gene variation to detect co-inheritance. Korea shows a negative delta (-0.042) because 95.2% of its cofit pairs have NaN phi (both genes at 100% prevalence across 72 genomes, producing zero-variance vectors). Only ~8,000 of 166,601 pairs are computable, and the negative delta reflects statistical noise in this small effective sample rather than a biological signal.
(Notebook: 02_cooccurrence.ipynb, 04_cross_organism.ipynb)
Operons Are Not a Confound
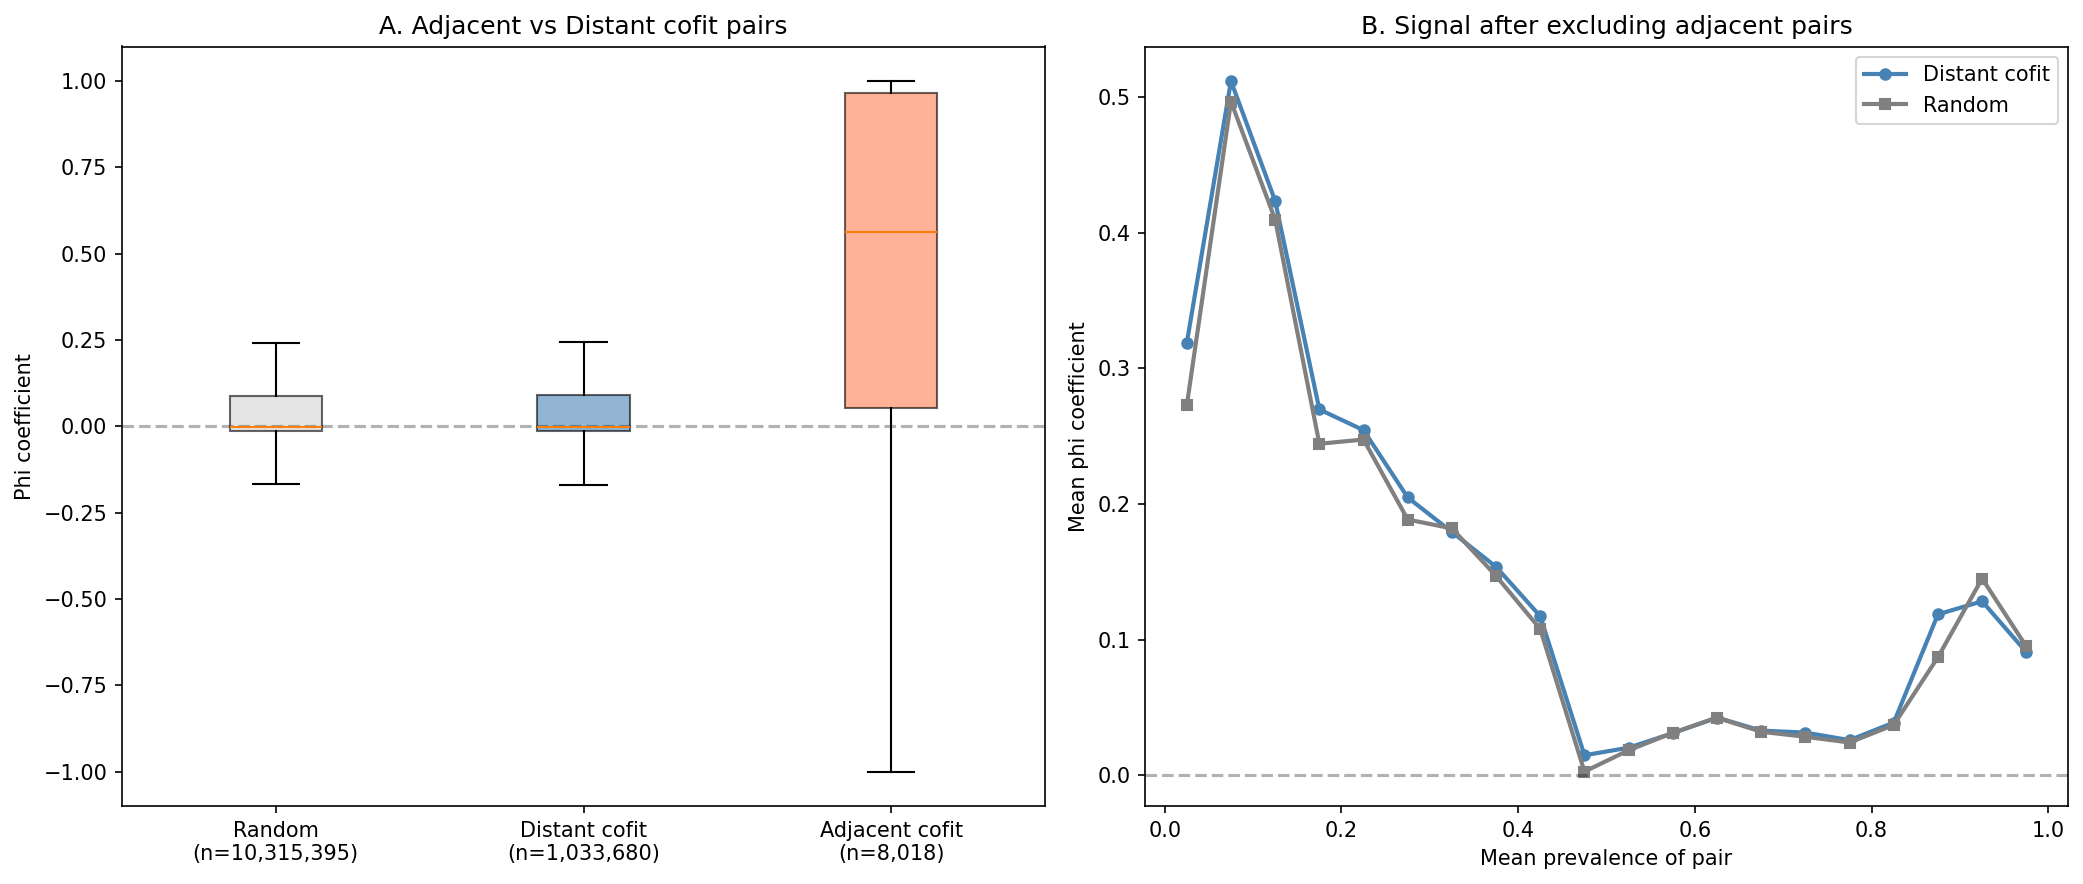
Only 0.7% of cofit pairs are genomically adjacent (within 5 genes). Excluding them does not change the result pattern.
(Notebook: 02_cooccurrence.ipynb)
ICA Modules Show Co-inheritance, Especially Accessory Modules
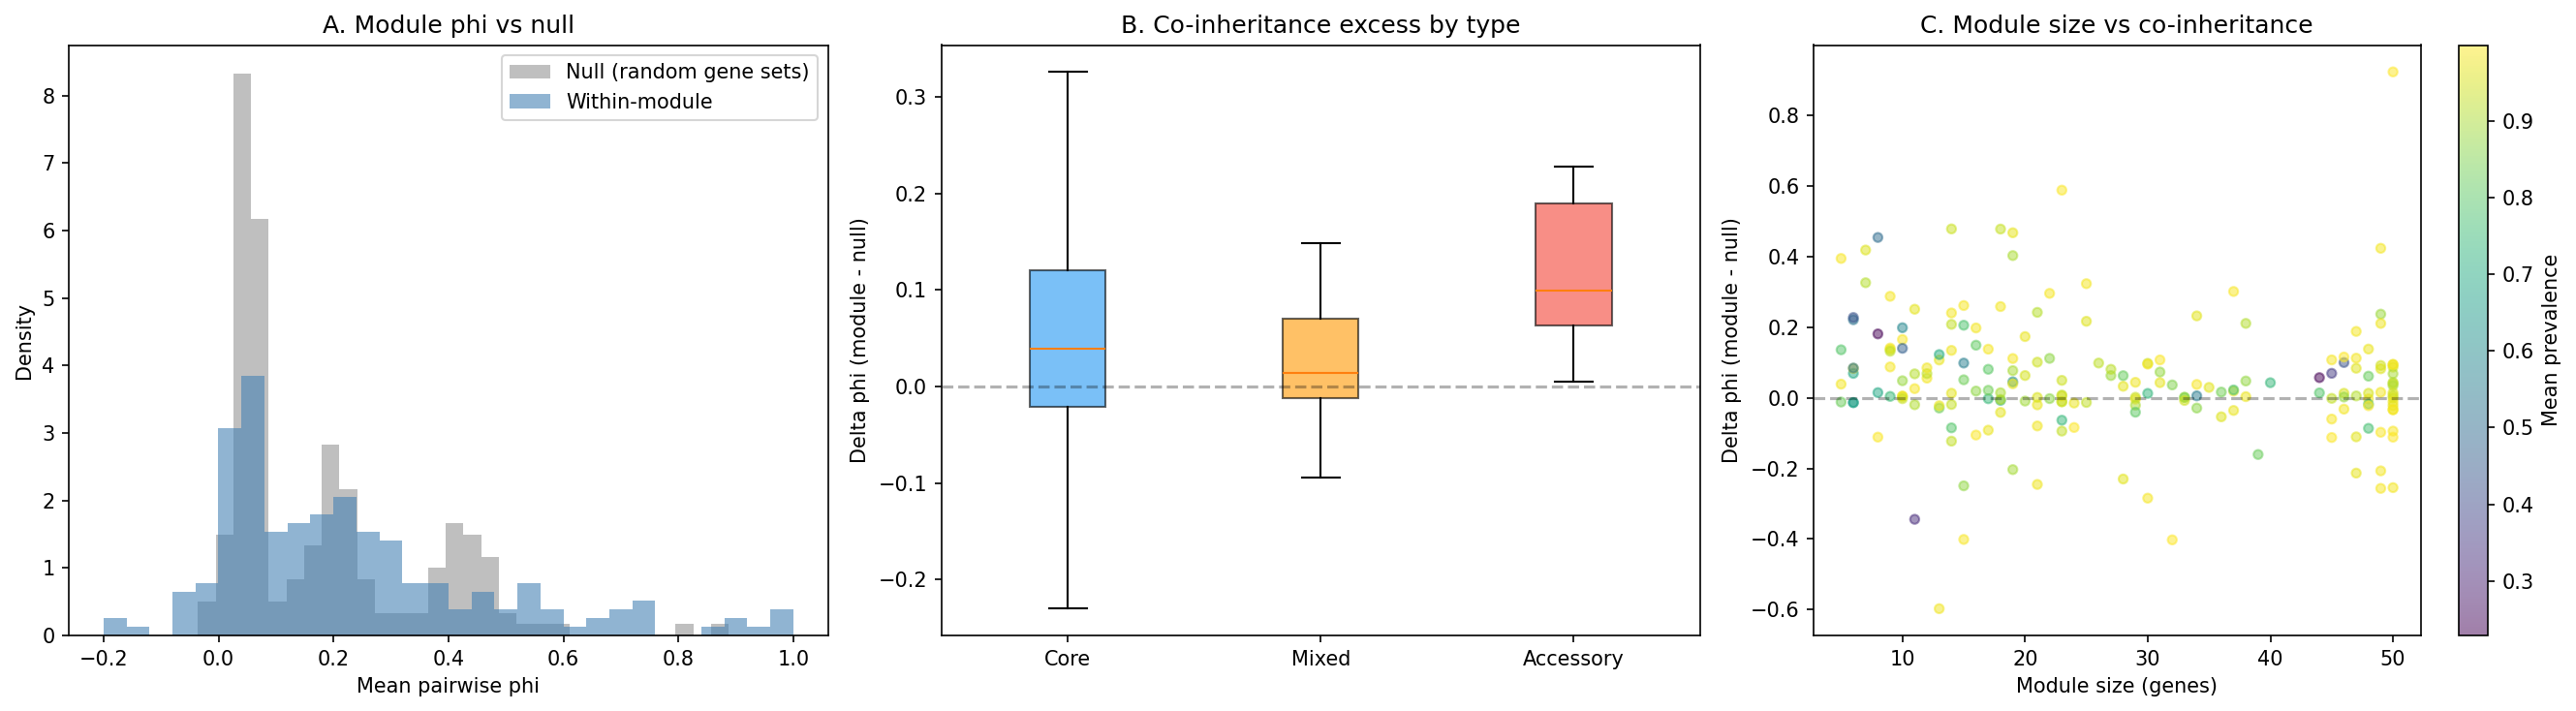
At the module level, 195 ICA modules across 6 organisms show within-module co-occurrence (mean phi=0.229) significantly exceeding prevalence-matched null expectations (mean phi=0.177, 1000 permutations), with delta=+0.053 and 51/195 modules (26%) significant at p<0.05. After Benjamini-Hochberg FDR correction, 21/195 modules (11%) remain significant at q<0.05.
Accessory modules show the strongest co-inheritance signal:
| Module type | n | Mean delta phi | Significant (p<0.05) | Significant (FDR q<0.05) |
|---|---|---|---|---|
| Accessory (<50% core) | 11 | +0.108 | 8/11 (73%) | 4/11 (36%) |
| Core (>90% core) | 120 | +0.059 | 29/120 (24%) | 13/120 (11%) |
| Mixed (50-90%) | 64 | +0.031 | 14/64 (22%) | 4/64 (6%) |
The accessory vs core difference trends toward significance (Mann-Whitney p=0.051).
(Notebook: 03_module_coinheritance.ipynb)
Co-fitness Strength Weakly Anti-correlates with Co-occurrence
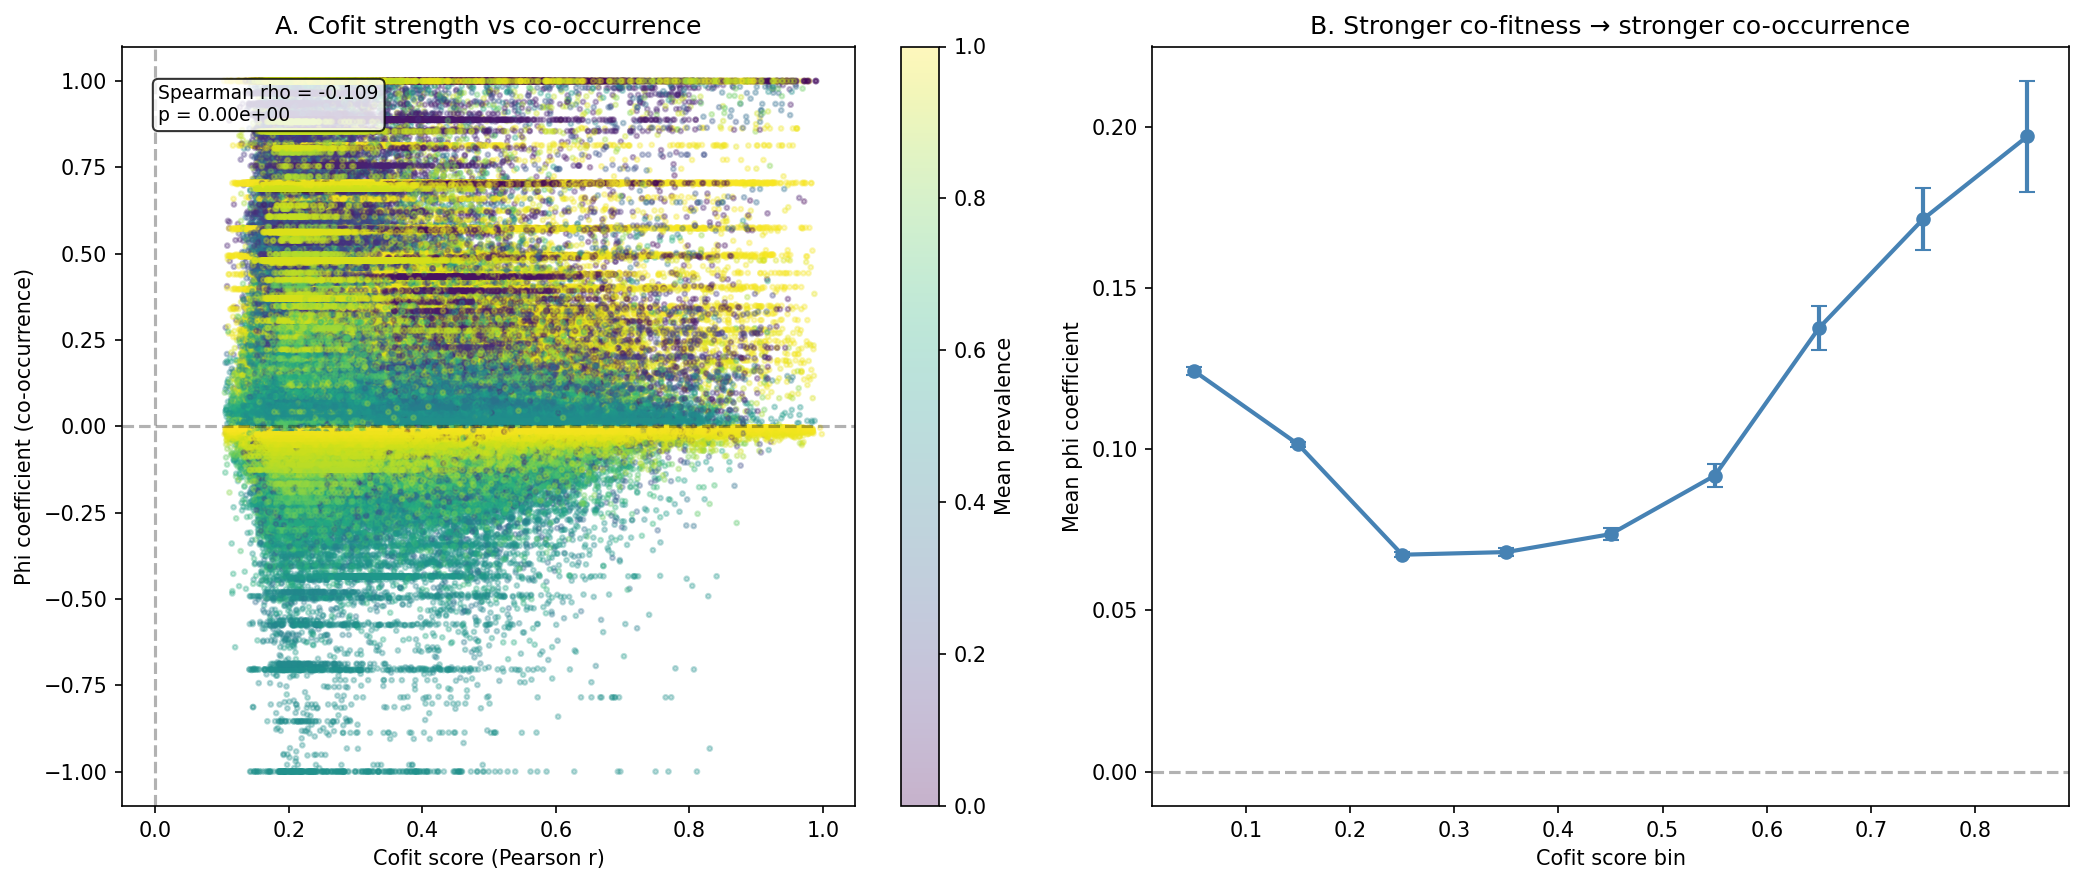
Stronger co-fitness scores weakly predict lower phi (Spearman rho=-0.109, p<1e-300 across 1.04M pairs). This likely reflects that the strongest co-fitness pairs are core genes with near-universal prevalence, leaving little variance for co-occurrence detection — a prevalence ceiling effect.
(Notebook: 02_cooccurrence.ipynb)
Phylogenetic Distance Stratification
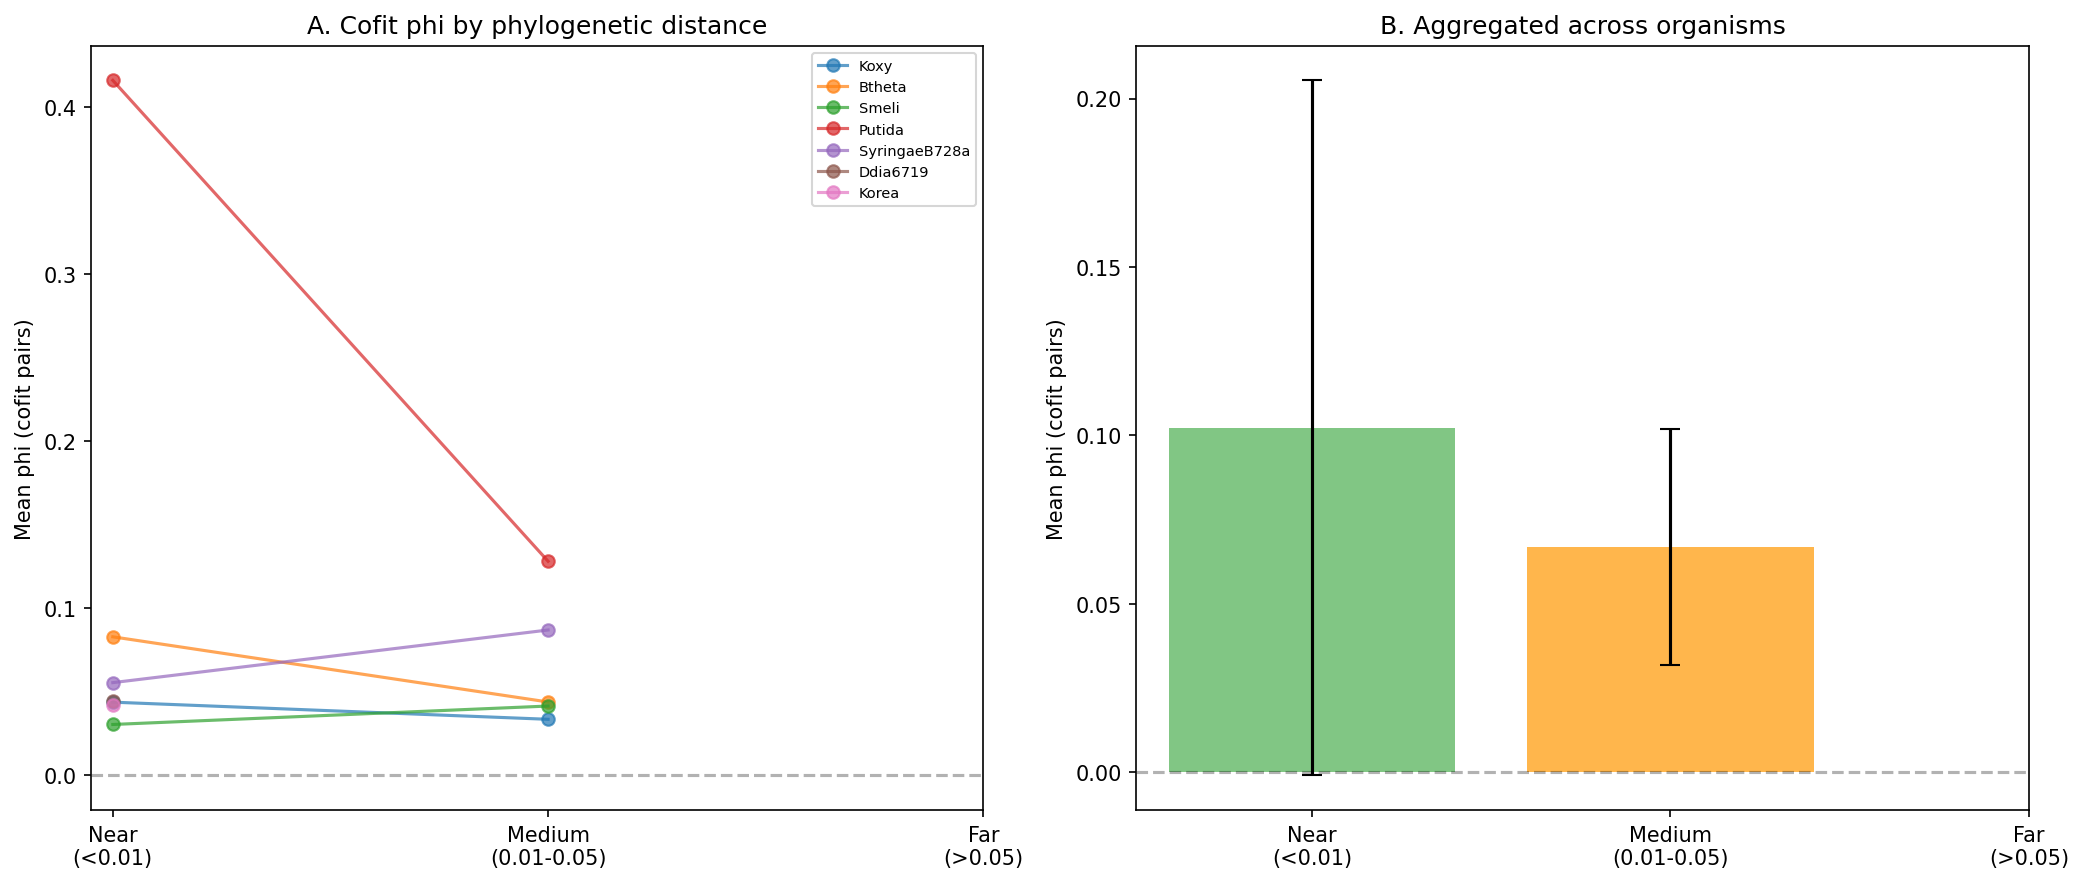
Cofit pair phi is higher among near genomes (mean=0.102) than medium genomes (mean=0.067), as expected from shared ancestry. Most species lack genomes in the “far” stratum (>0.05 branch distance), limiting the ability to fully disentangle functional coupling from phylogenetic signal.
(Notebook: 02_cooccurrence.ipynb)
Results
Data Extraction
11 target species analyzed. Presence matrices extracted via Spark from gene_genecluster_junction joined with gene (two billion-row tables). BROADCAST hints on small filter tables reduced query time to ~210s per organism.
| Organism | Genomes | Clusters | Cofit pairs | Phylo tree |
|---|---|---|---|---|
| Koxy | 399 | 4,942 | 423,936 | Yes |
| Btheta | 287 | 4,649 | 328,455 | Yes |
| Smeli | 241 | 6,004 | 528,699 | Yes |
| RalstoniaUW163 | 141 | 4,413 | 0 | Yes |
| Putida | 128 | 5,409 | 458,688 | Yes |
| SyringaeB728a | 126 | 4,999 | 371,004 | Yes |
| Korea | 72 | 4,075 | 230,724 | Yes |
| RalstoniaGMI1000 | 70 | 4,723 | 0 | Yes |
| Phaeo | 43 | 3,790 | 192,138 | No |
| Ddia6719 | 66 | 4,694 | 250,488 | Yes |
| pseudo3_N2E3 | 40 | 5,513 | 507,828 | No |
Ralstonia UW163 and GMI1000 have zero co-fitness data in the Fitness Browser despite being in the organism table, excluding them from the primary analysis.
(Notebook: 01_data_extraction.ipynb)
Pairwise Analysis
For each organism, cofit pairs were mapped to pangenome cluster pairs via fb_pangenome_link.tsv, deduplicated, and phi coefficients computed from binary genome x cluster presence vectors. 10 prevalence-matched random pairs were generated per cofit pair, matching each cluster’s prevalence independently (tolerance +/-5%). Adjacency was determined from FB gene coordinates (within 5 loci on the same scaffold).
Aggregate statistics:
- 9 organisms analyzed
- 2,253,491 cofit pairs, 22,534,910 random pairs
- Overall mean phi: cofit=0.092, random=0.089
- Overall delta: +0.003 (Mann-Whitney two-sided p=1.66e-29)
- Organisms with positive delta: 7/9
- Organisms with p<0.05: 8/9
- Wilcoxon signed-rank (delta > 0): W=9, p=0.13
Module Analysis
For 6 organisms with ICA module data (Koxy, Btheta, Putida, Korea, Phaeo, pseudo3_N2E3), mean pairwise phi was computed within each module and compared to 1000 prevalence-matched random gene sets. P-values were corrected for multiple testing using Benjamini-Hochberg FDR.
Per-organism module results:
| Organism | Modules | Significant | Mean phi | Null mean |
|---|---|---|---|---|
| Koxy | 44 | 14 (32%) | 0.079 | 0.040 |
| Btheta | 36 | 22 (61%) | 0.192 | 0.086 |
| Putida | 38 | 6 (16%) | 0.266 | 0.202 |
| Korea | 29 | 0 (0%) | 0.357 | 0.308 |
| Phaeo | 37 | 3 (8%) | 0.108 | 0.095 |
| pseudo3_N2E3 | 40 | 4 (10%) | 0.444 | 0.409 |
Btheta shows the strongest module-level signal (61% significant), while Korea (despite being the best pairwise organism) shows 0% significant modules — all Korea modules are >90% core with prevalence near 1.0.
Functional Enrichment
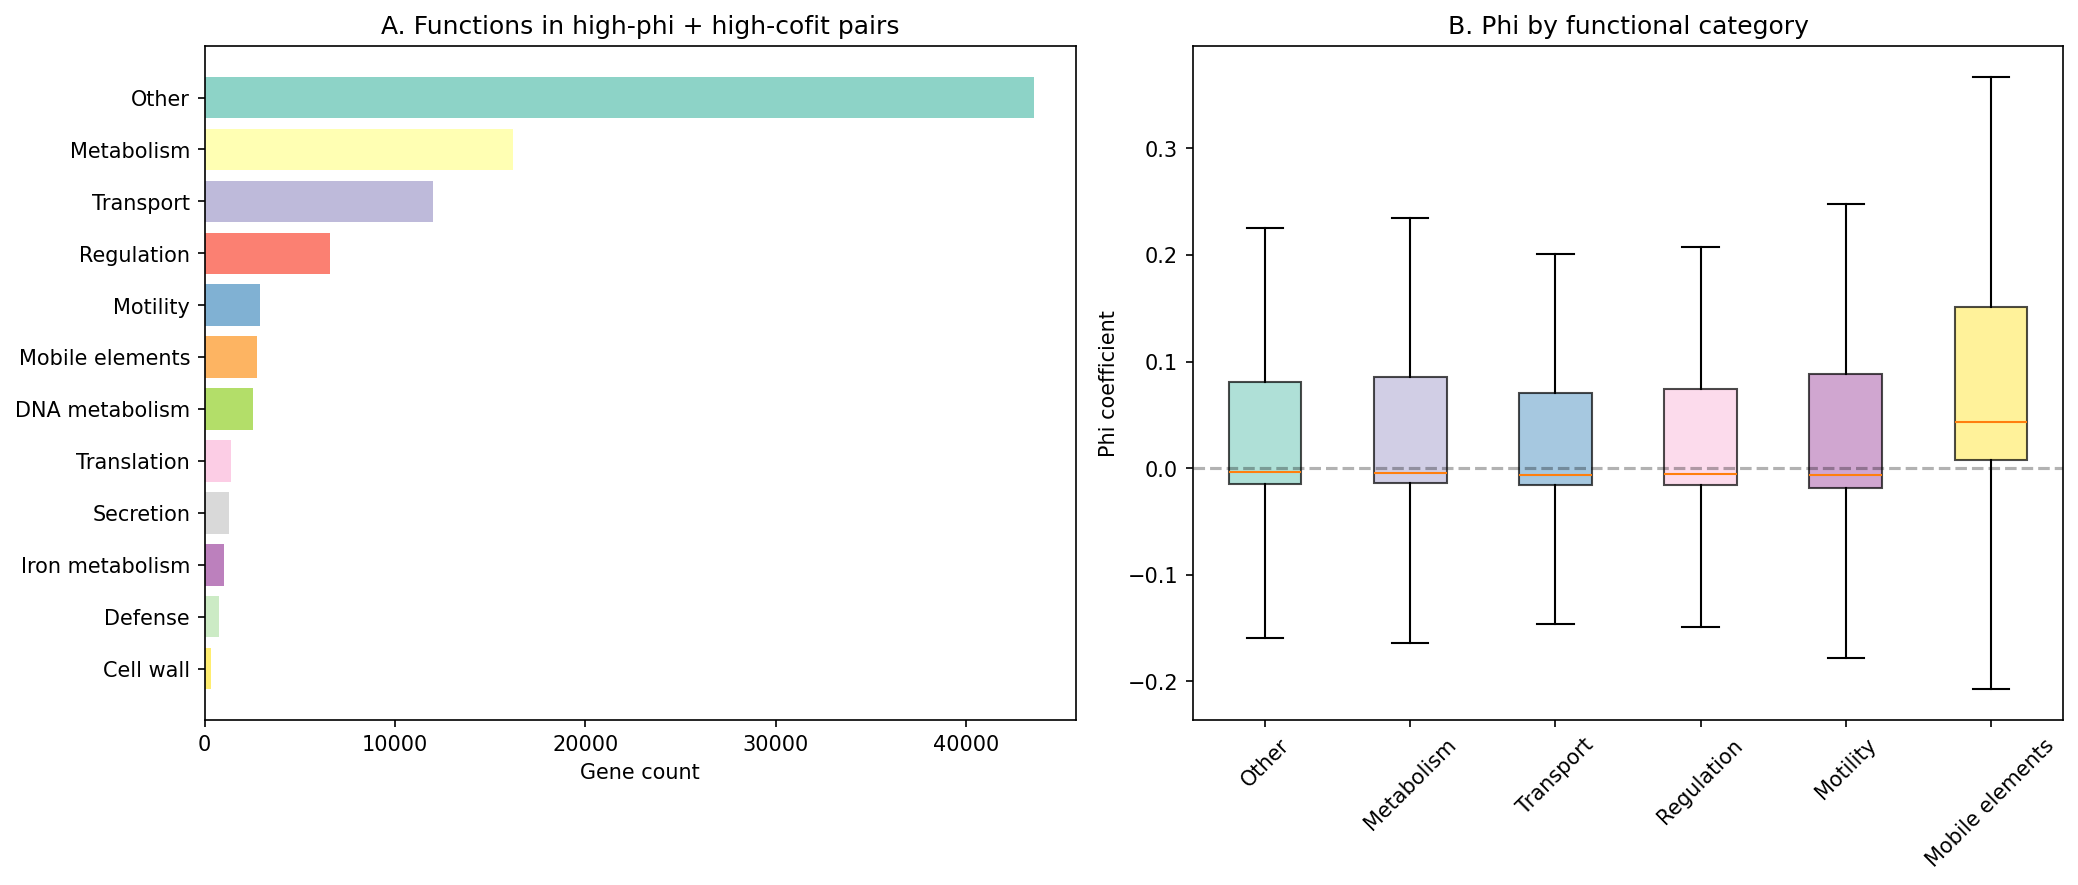
Among high-phi AND high-cofit pairs (top quartile of both), the most common functional categories (SEED annotations) are:
| Category | Gene count |
|---|---|
| Metabolism | 15,936 |
| Transport | 11,940 |
| Regulation | 6,339 |
| Motility | 2,929 |
| Mobile elements | 2,716 |
| DNA metabolism | 2,490 |
(Notebook: 04_cross_organism.ipynb)
Interpretation
Pairwise co-fitness weakly but consistently predicts co-inheritance: 7 of 9 organisms show a positive delta phi, and the aggregate signal is highly significant (p=1.66e-29). However, the effect size is small (delta=+0.003 overall, +0.011 mean across organisms), indicating that lab-measured functional coupling explains only a tiny fraction of co-inheritance patterns.
Multi-gene modules (ICA-derived co-regulated groups) show a substantially stronger co-inheritance signal (delta=+0.053, 26% significant at p<0.05, 11% after FDR correction), particularly accessory modules (73% significant, 36% after FDR). This suggests that coordinated regulation across multiple genes — not just pairwise functional similarity — is what most strongly constrains co-inheritance. The 48 accessory modules identified in the module_conservation project represent functionally coherent units that travel together through the pangenome.
The pairwise signal is attenuated by a prevalence ceiling: most FB genes map to core clusters (>95% prevalence), where phi approaches 0 for both cofit and random pairs because there is almost no variance to correlate. Species with more gene content diversity (Ddia6719, pseudo3_N2E3) show the largest positive deltas.
Literature Context
- Hall et al. (2021) found that E. coli accessory genes co-occur by function and via mobile genetic elements, consistent with our module-level result showing functional coherence predicts co-inheritance (PMID: 34499026).
- Whelan et al. (2020) developed Coinfinder to detect gene associations in pangenomes while controlling for phylogeny. Our analysis extends this by asking whether fitness-measured functional coupling predicts the associations Coinfinder would detect (PMID: 32100706).
- Choudhury et al. (2025) showed P. aeruginosa phylogroups have distinct co-occurrence networks, reinforcing that accessory genome structure is lineage-specific (PMID: 40304385).
- Price et al. (2018) established the Fitness Browser co-fitness data used here. Co-fitness identifies genes in the same pathway or complex; our results show this lab-measured coupling weakly but significantly predicts co-inheritance in natural populations, though the effect size is small (PMID: 29769716).
Limitations
- Prevalence ceiling: Most FB genes map to core clusters (>95% prevalence). At high prevalence, phi approaches 0 for both cofit and random pairs because there is almost no variance to correlate. The analysis is most informative for species with substantial auxiliary gene content.
- Ralstonia excluded: The two Ralstonia organisms (most phylogenetically diverse, lowest ANI) have zero co-fitness data in the Fitness Browser, excluding the species that would likely be most informative.
- Phylogenetic control limited to two strata: Phylogenetic distance stratification was computed for 7 of 9 organisms, but most species lack genomes in the “far” stratum (>0.05 branch distance). Cofit pair phi is higher among near genomes (mean=0.102) than medium genomes (mean=0.067), as expected from shared ancestry, but the lack of a far stratum limits the ability to fully disentangle functional coupling from phylogenetic signal.
- Pairwise vs multi-gene: Co-fitness captures pairwise gene relationships. ICA modules capture multi-gene coordinated regulation, which may better reflect the selective units that constrain co-inheritance.
- Near-clonal species behave differently: Ddia6719 (ANI 99.47%) shows the strongest pairwise signal (delta=+0.093), while pseudo3_N2E3 (ANI 99.66%) also shows positive delta (+0.026). Despite low overall genome diversity, these species have sufficient accessory gene variation to detect co-inheritance. However, the high baseline phi in these species means the absolute phi values are less interpretable.
Future Directions
- Restrict to auxiliary-only pairs: Re-analyze using only gene pairs where both clusters are auxiliary (<95% prevalence) to maximize presence/absence variance.
- Compute co-fitness directly: For Ralstonia and other organisms lacking pre-computed co-fitness, calculate pairwise Pearson correlations from raw
genefitnessdata. - Fix phylogenetic control: Resolve the reference genome mapping to enable phylogenetic distance stratification.
- Module co-transfer networks: Build networks of which modules co-occur across species and test whether co-fitness predicts cross-module co-inheritance.
- Expand to more diverse species: Target additional organisms with >30% auxiliary genes and existing co-fitness data.
Data
Sources
| Dataset | Description | Source |
|---|---|---|
| Fitness Browser co-fitness | Top-20 co-fitness partners per gene | cofit table via Spark |
| KBase pangenome | Genome x cluster presence matrices | gene_genecluster_junction + gene tables via Spark |
| Phylogenetic distances | Pairwise genome distances | phylogenetic_tree_distance_pairs table via Spark |
| FB-pangenome link table | Gene-to-cluster mapping (177K links) | conservation_vs_fitness/data/fb_pangenome_link.tsv |
| ICA fitness modules | Co-regulated gene modules | fitness_modules/data/modules/ |
| Module conservation | Module conservation stats | module_conservation/data/module_conservation.tsv |
| SEED annotations | Functional category assignments | conservation_vs_fitness/data/seed_annotations.tsv |
Generated Data
| File | Description |
|---|---|
data/genome_cluster_matrices/{org}_presence.tsv | Binary genome x cluster presence matrices (11 species) |
data/cofit/{org}_cofit.tsv | Co-fitness pairs per organism from Fitness Browser |
data/gene_coords/{org}_coords.tsv | Gene coordinates for adjacency detection |
data/phylo_distances/{org}_phylo_distances.tsv | Pairwise phylogenetic distances (9 species) |
data/{org}_phi_results.tsv | Per-organism phi results for cofit and random pairs |
data/all_phi_results.tsv | Combined phi results across all organisms |
data/organism_summary.tsv | Per-organism effect sizes and p-values |
data/module_coinheritance.tsv | Module-level co-inheritance scores |
data/phylo_stratified.tsv | Cofit pair phi stratified by phylogenetic distance |
References
- Price MN et al. (2018). “Mutant phenotypes for thousands of bacterial genes of unknown function.” Nature 557:503-509. PMID: 29769716
- Parks DH et al. (2022). “GTDB: an ongoing census of bacterial and archaeal diversity through a phylogenetically consistent, rank normalized and complete genome-based taxonomy.” Nucleic Acids Res 50:D199-D207. PMID: 34520557
- Hall JPJ et al. (2021). “Gene-gene relationships in an Escherichia coli accessory genome are linked to function and mobility.” Microb Genom 7:000650. PMID: 34499026
- Whelan FJ et al. (2020). “Coinfinder: detecting significant associations and dissociations in pangenomes.” Microb Genom 6:e000338. PMID: 32100706
- Choudhury M et al. (2025). “Phylogroup-specific co-occurrence networks in Pseudomonas aeruginosa.” PMID: 40304385
Supporting Evidence
Figures
| Figure | Description |
|---|---|
figures/fig1_cofit_cooccurrence.png | Phi vs prevalence curves for cofit vs random pairs, per-organism and aggregated |
figures/fig2_operon_control.png | Adjacent vs distant cofit pairs; signal after excluding operons |
figures/fig3_phylo_control.png | Cofit pair phi stratified by phylogenetic distance from reference strain |
figures/fig4_cofit_strength.png | Co-fitness score vs phi coefficient scatter and binned means |
figures/fig5_module_coinheritance.png | Module co-inheritance: phi vs null by module type, size effects |
figures/fig6_functional.png | Functional categories enriched among high-phi high-cofit pairs |
Notebooks
| Notebook | Purpose |
|---|---|
notebooks/01_data_extraction.ipynb | Spark: genome x cluster matrices, cofit data |
notebooks/02_cooccurrence.ipynb | Local: phi computation + prevalence analysis |
notebooks/03_module_coinheritance.ipynb | Local: module-level co-inheritance |
notebooks/04_cross_organism.ipynb | Local: meta-analysis + figures |
Revision History
- v1 (2026-02): Initial report
- v2 (2026-02): Added inline figures, notebook provenance, Data section, References section, renamed Visualizations to Figures