Key Findings
1. AMR Genes Are Massively Depleted from the Core Genome
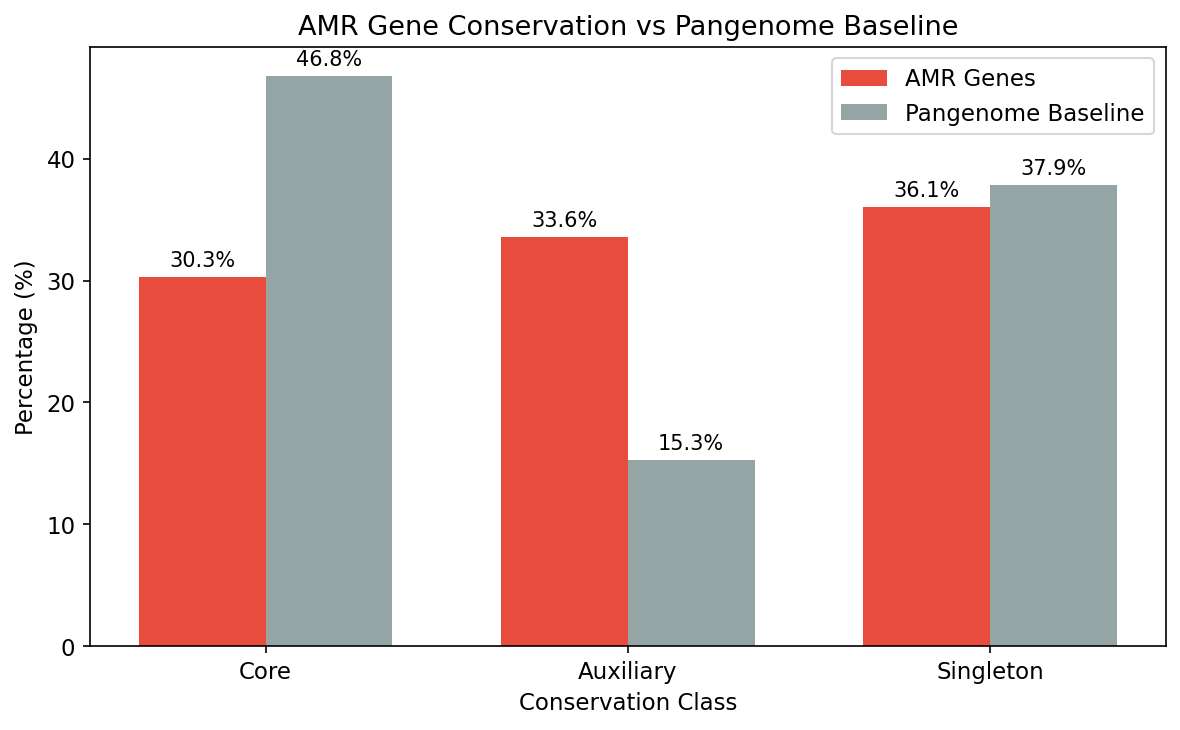
AMR genes are significantly less conserved than the pangenome average: only 30.3% are core vs 46.8% baseline (OR=0.49, chi-squared=23,117, p≈0). The auxiliary genome is 2.2x enriched for AMR (33.6% vs 15.3%). This depletion is consistent across species: in a paired test of 4,252 species (each with ≥5 AMR clusters), 63.7% show AMR less core than their species baseline (Wilcoxon p=1.1e-130, mean difference -0.102).
(Notebook: 01_amr_census.ipynb, 02_conservation_patterns.ipynb)
2. Intrinsic vs Acquired Resistance Creates a Conservation Dichotomy
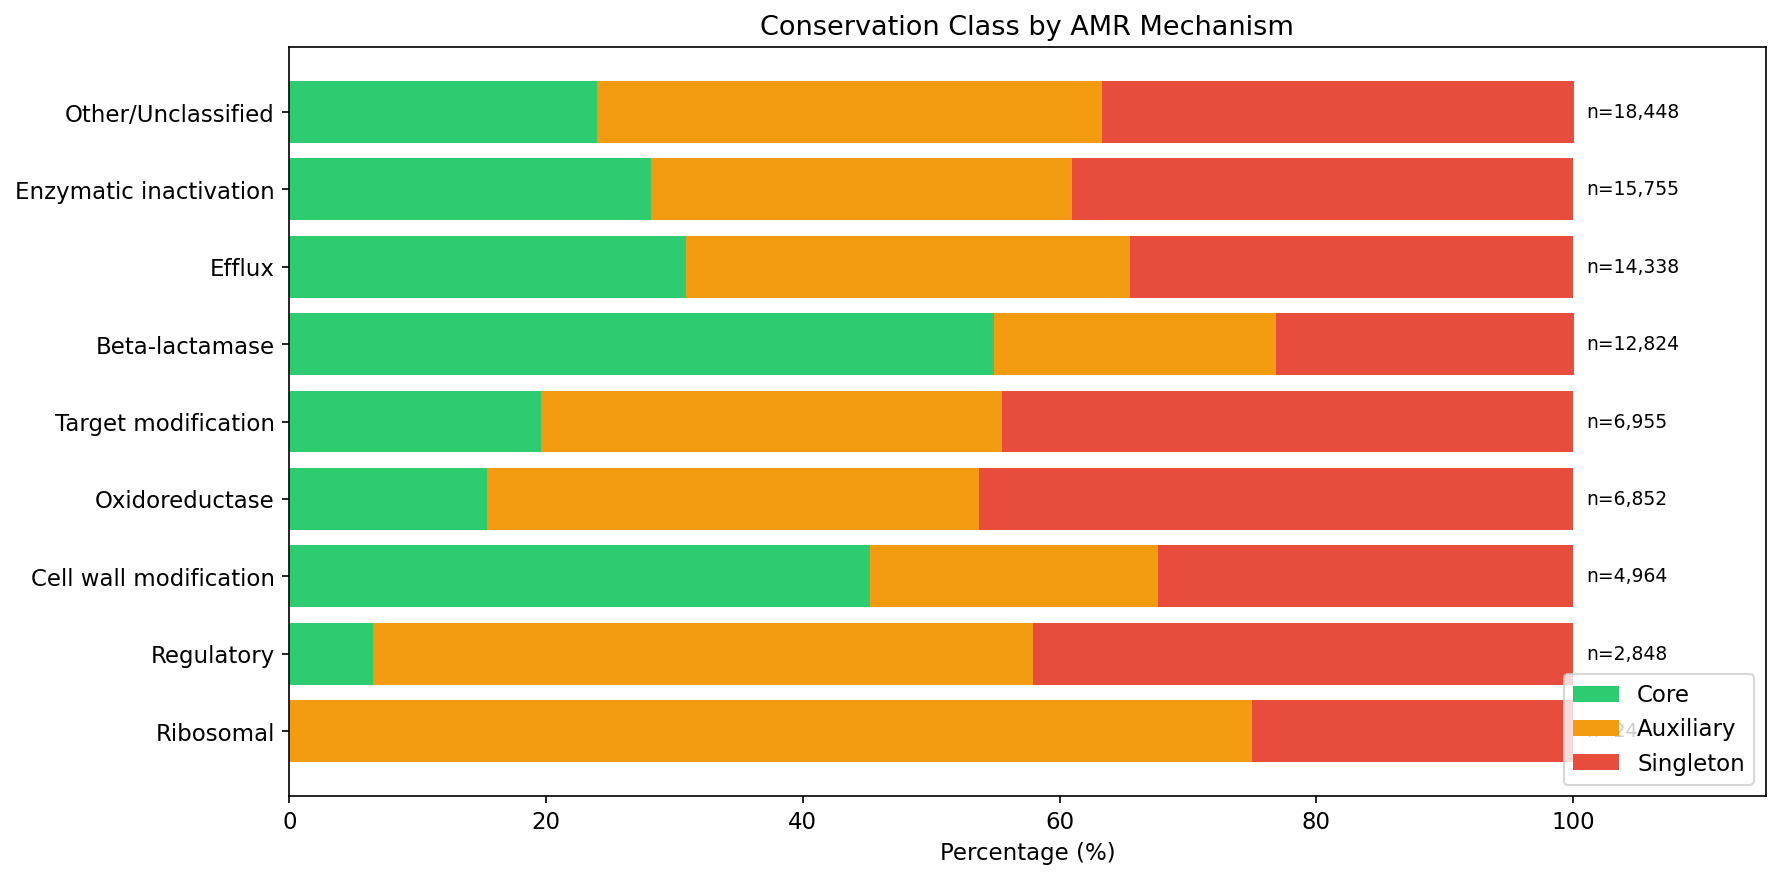
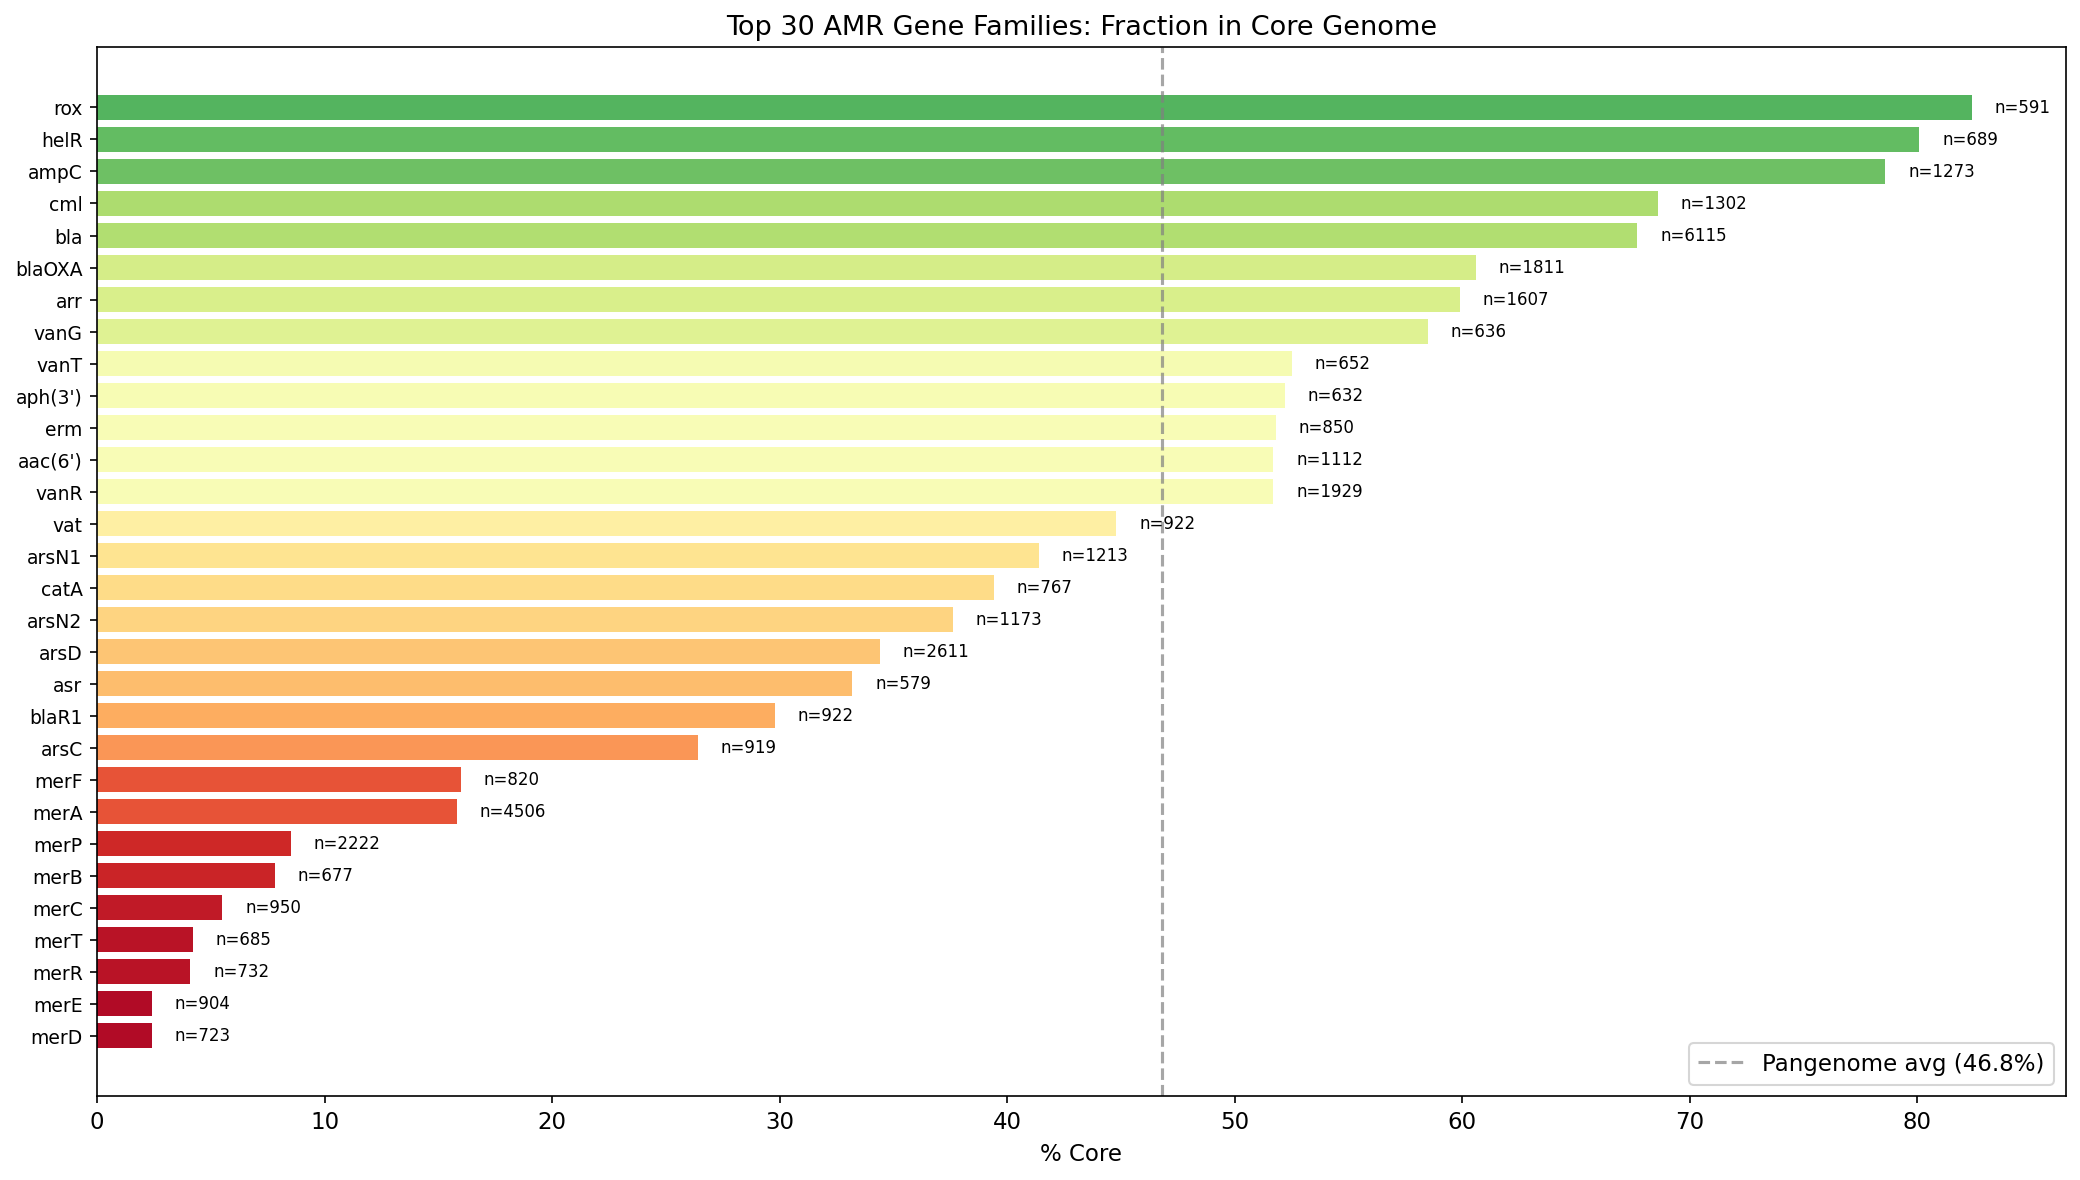
Not all AMR mechanisms behave the same. Beta-lactamases are 54.9% core (p=7.7e-74 for enrichment vs baseline) — these are intrinsic resistance genes present in the species’ chromosomal backbone. In contrast, regulatory genes are only 6.5% core, and known mobile elements like blaTEM, tet(C), and ant(2”)-Ia are 0% core (fully accessory/singleton). Efflux pumps split: intrinsic pumps like emhABC are >95% core, while acquired efflux genes are accessory.
(Notebook: 02_conservation_patterns.ipynb)
3. AMR Hotspots Are Concentrated in Clinical Pathogens
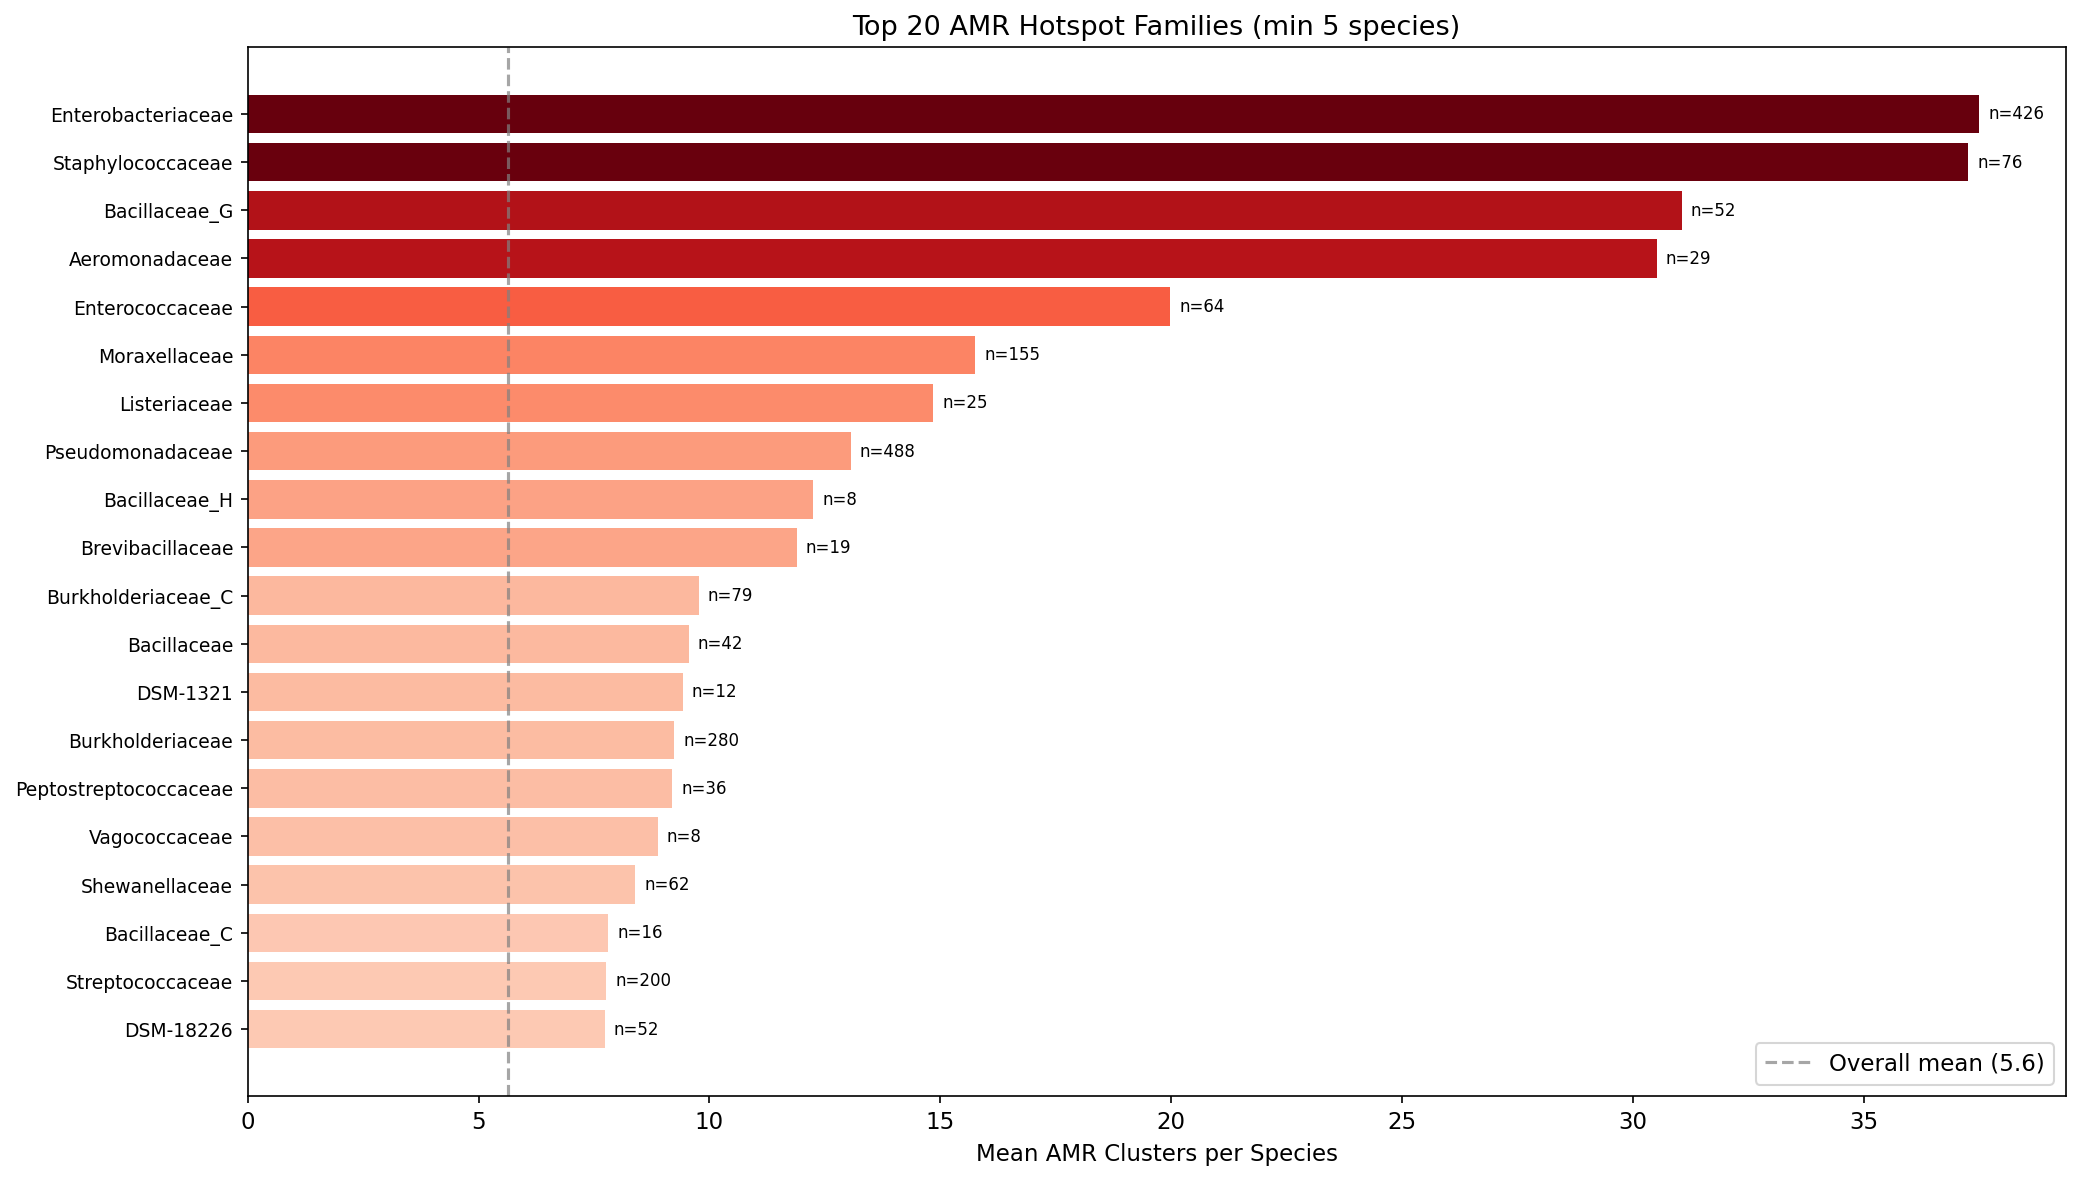
AMR gene density is highly phylogenetically structured. At the genus level, Klebsiella leads with 206 AMR clusters per species, followed by Salmonella (198), Citrobacter (134), and Enterobacter (93). Gammaproteobacteria contain 45% of all AMR clusters (37,752/83,008). The top hotspot families are Enterobacteriaceae (37.5 AMR/species) and Staphylococcaceae (37.3 AMR/species) — both dominated by clinical pathogens.
Within phyla, pangenome openness positively correlates with AMR count in 8/10 tested phyla, strongest in Bacillota (rho=0.219, p=1.0e-16) and Bacillota_C (rho=0.374, p=3.1e-5). The overall correlation is near zero (rho=0.006), indicating phylogeny dominates the signal.
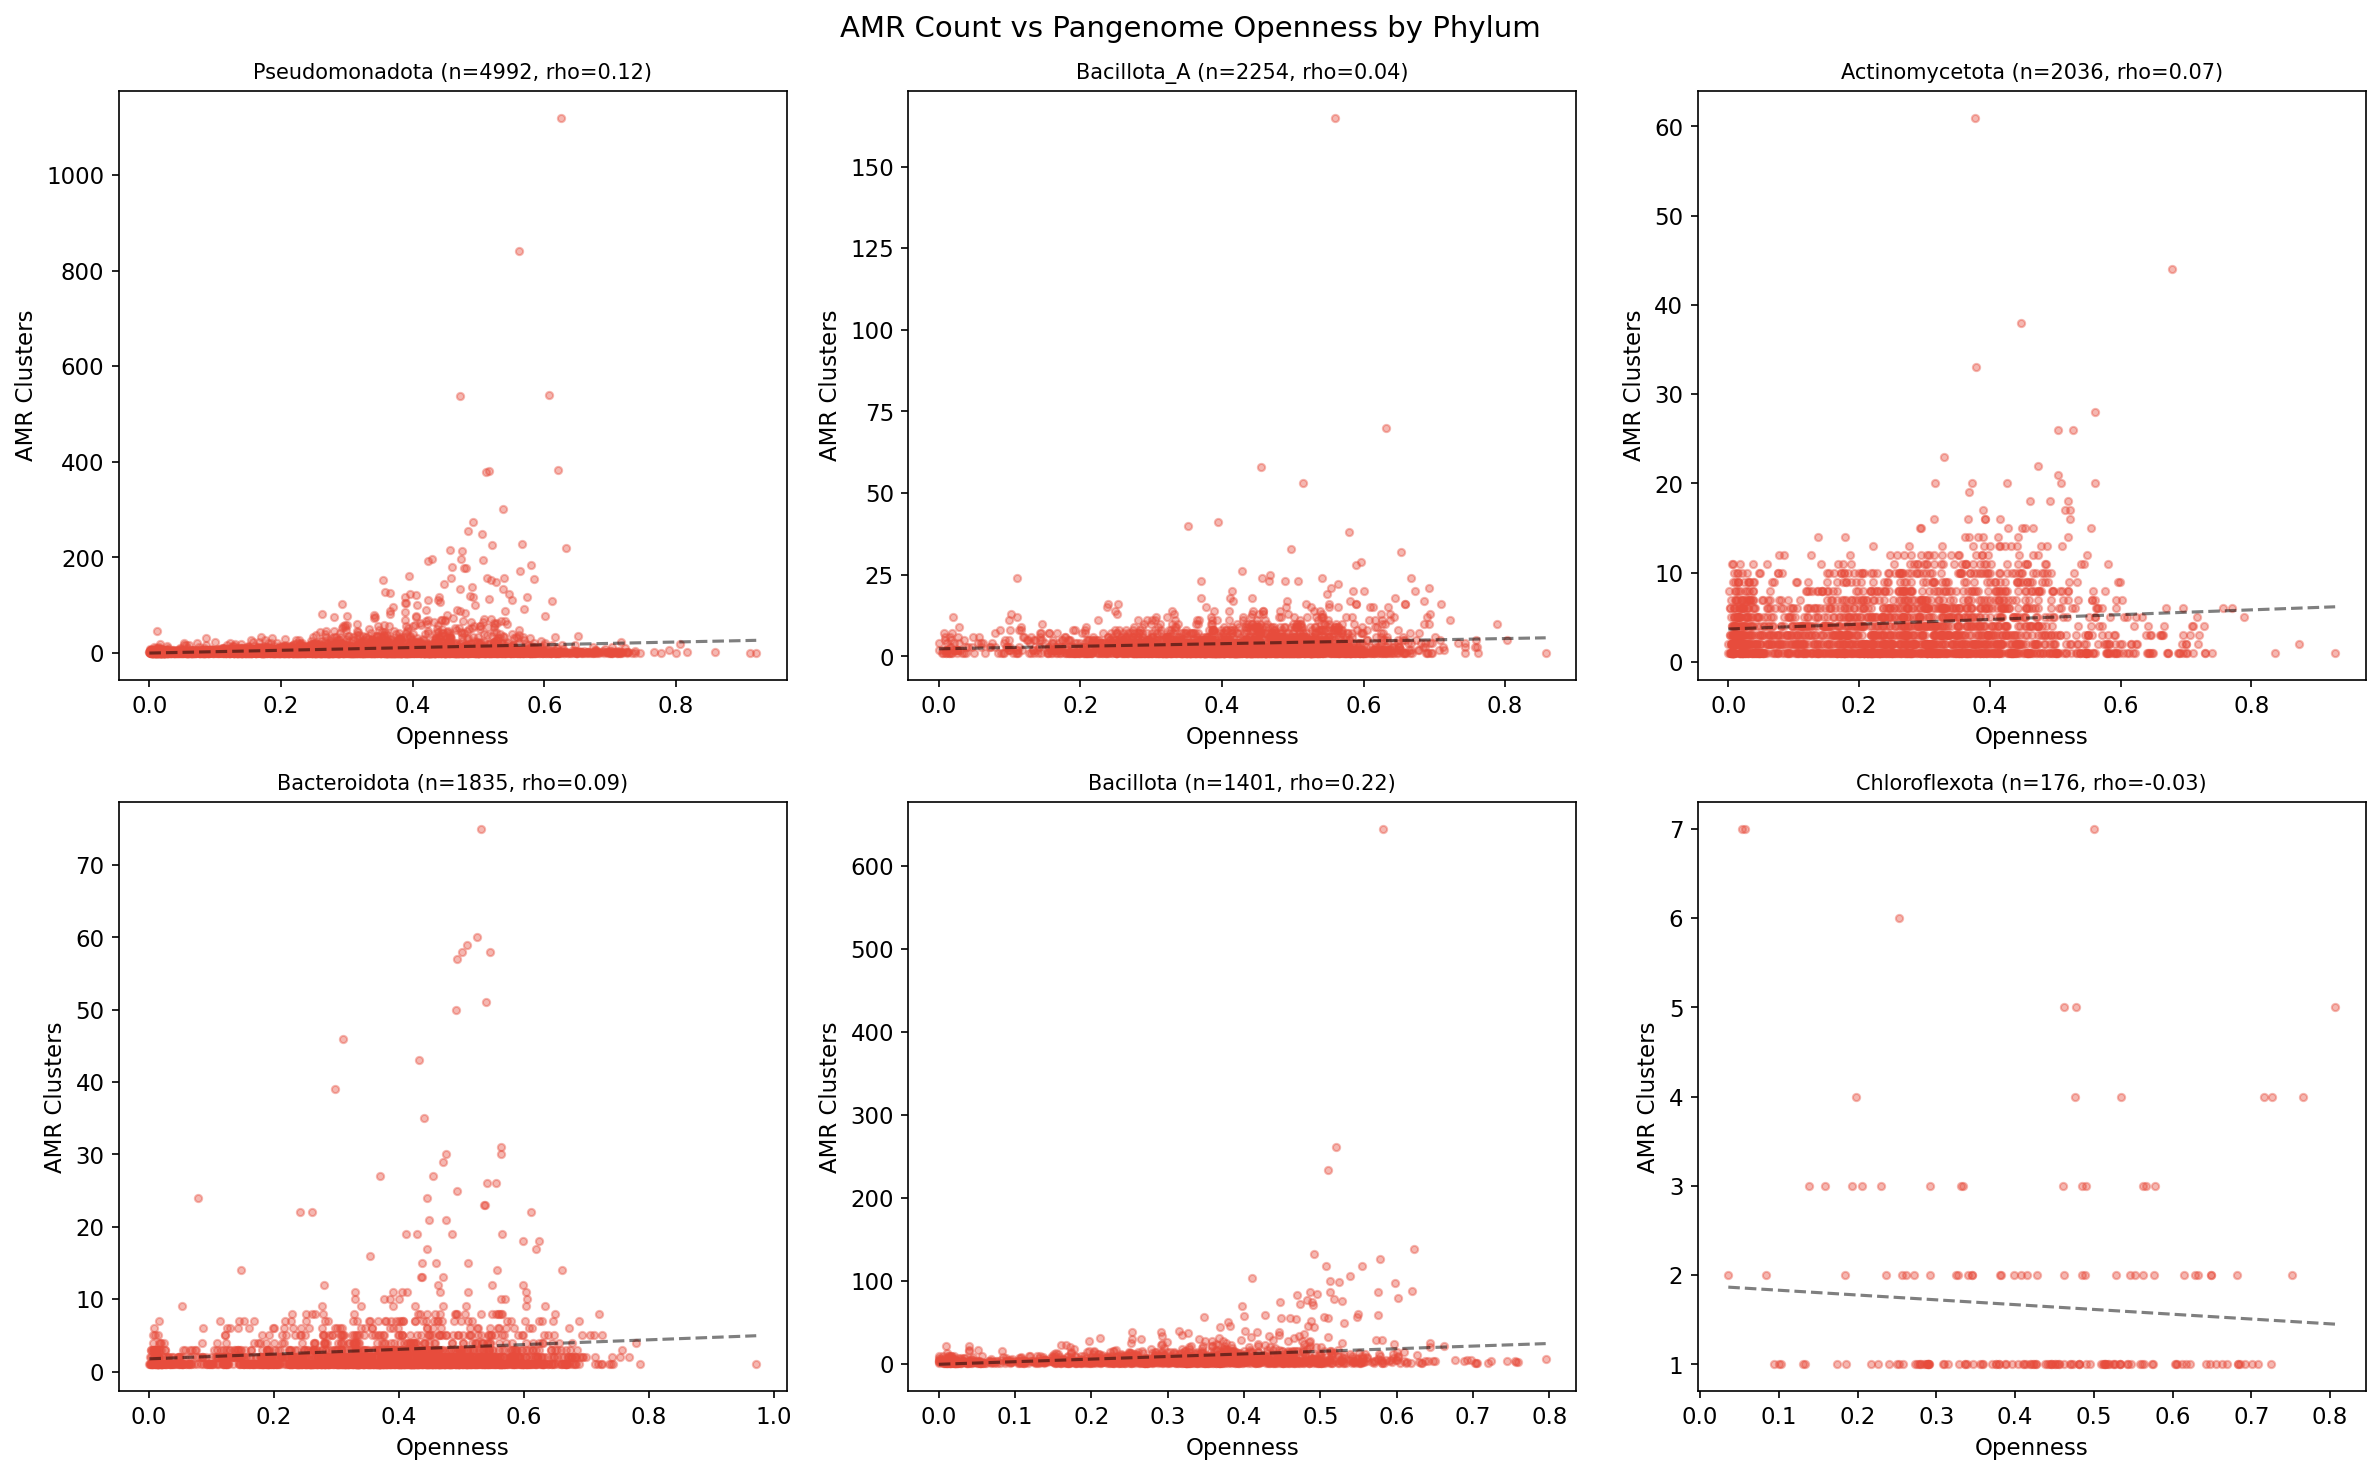
(Notebook: 01_amr_census.ipynb, 03_phylogenetic_distribution.ipynb)
4. AMR Genes Are Enriched in Defense and Ion Transport Functions
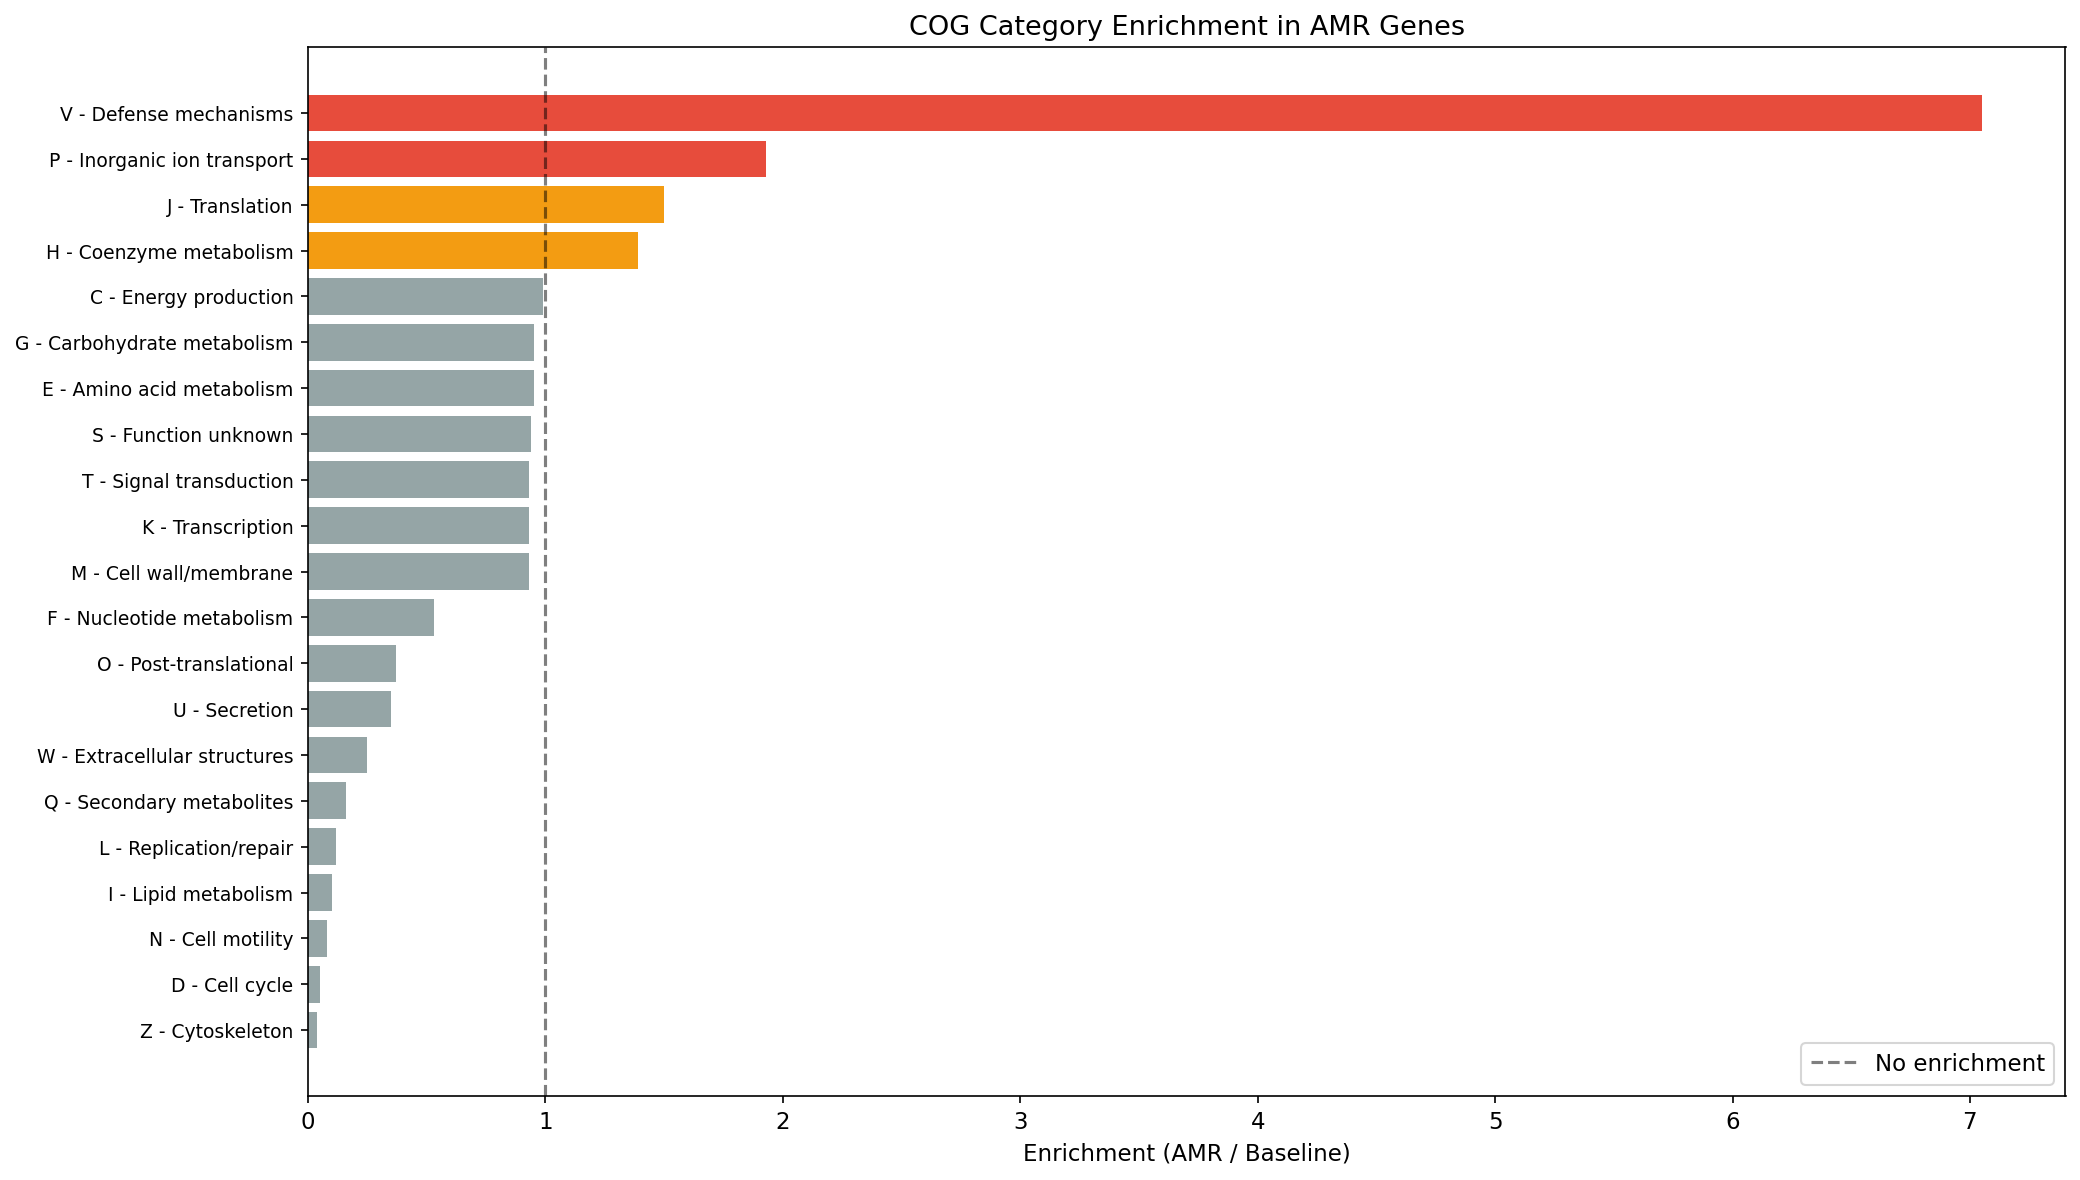
COG category analysis (77K AMR clusters with eggNOG annotations vs 86M baseline) reveals COG V (Defense mechanisms) is 7.05x enriched in AMR genes (14.9% vs 2.1%), confirming that AMR annotations target bona fide defense systems. COG P (Inorganic ion transport) is 1.93x enriched (10.7% vs 5.6%), reflecting the large mercury (merA, merP, merC) and arsenic (arsD, arsC) resistance gene families. COG J (Translation) is 1.50x enriched, consistent with ribosomal protection proteins (erm, helR). COG categories related to replication (L: 0.12x), lipid metabolism (I: 0.10x), and cell motility (N: 0.08x) are strongly depleted.
(Notebook: 04_functional_context.ipynb)
5. Clinical Species Carry 2.7x More AMR — and It’s More Acquired
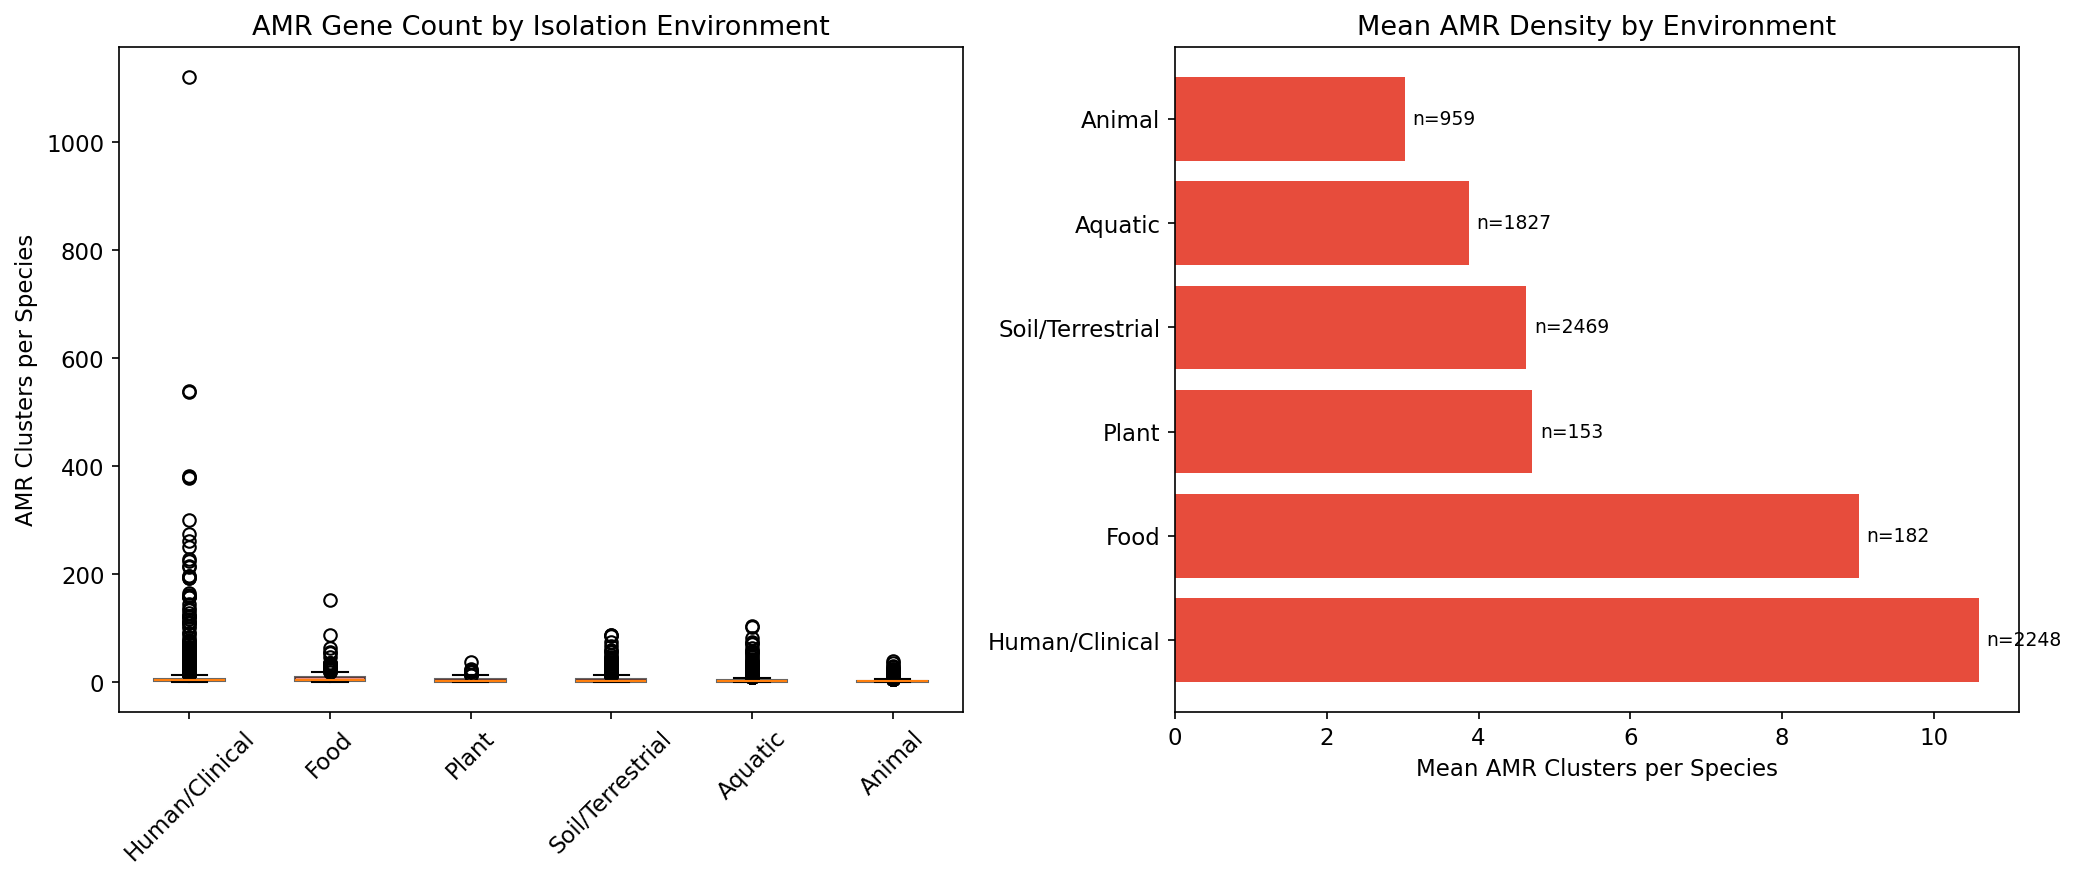
Species classified as Human/Clinical carry 10.6 AMR clusters per species (n=2,248), compared to 4.6 for Soil/Terrestrial (n=2,469), 3.9 for Aquatic (n=1,827), and 3.0 for Animal (n=959). This difference is highly significant (Kruskal-Wallis H=440, p=7.0e-93). Critically, clinical AMR is less core (30.8%) than soil AMR (58.1%) or plant AMR (63.1%), confirming that clinical environments select for acquired/mobile resistance while environmental AMR is predominantly intrinsic. Note: of the 14,723 AMR-carrying species, 7,838 (53.2%) received a non-”Other/Unknown” environment classification; the Kruskal-Wallis test is restricted to these well-classified species across 6 categories. The large “Other/Unknown” bin (46.8% of species) reflects the sparsity and inconsistency of free-text isolation_source metadata in NCBI BioSample records.
AlphaEarth embedding analysis (2,684 species with ≥3 genomes and embeddings) reveals that environmental diversity strongly predicts AMR count (Spearman rho=0.466, p=1.6e-144). Species sampled from more diverse environments carry more AMR genes, and those AMR genes are less core (rho=-0.173, p=1.8e-19).
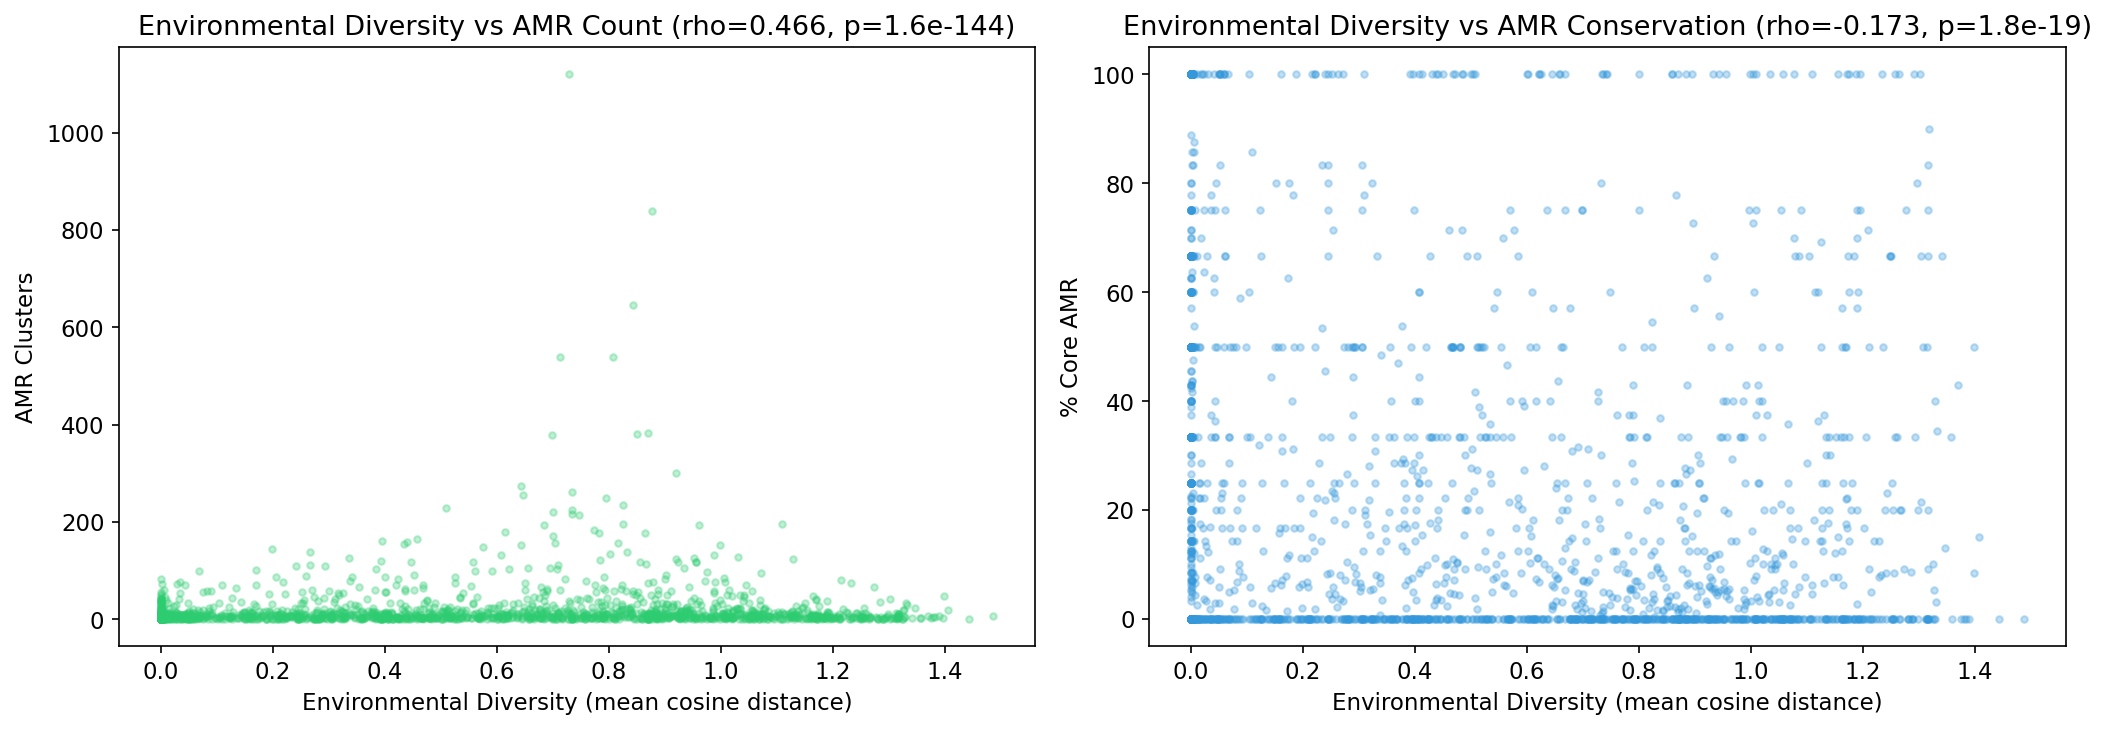
(Notebook: 05_environmental_distribution.ipynb)
6. AMR Genes Are Not a Fitness Burden in Lab Conditions
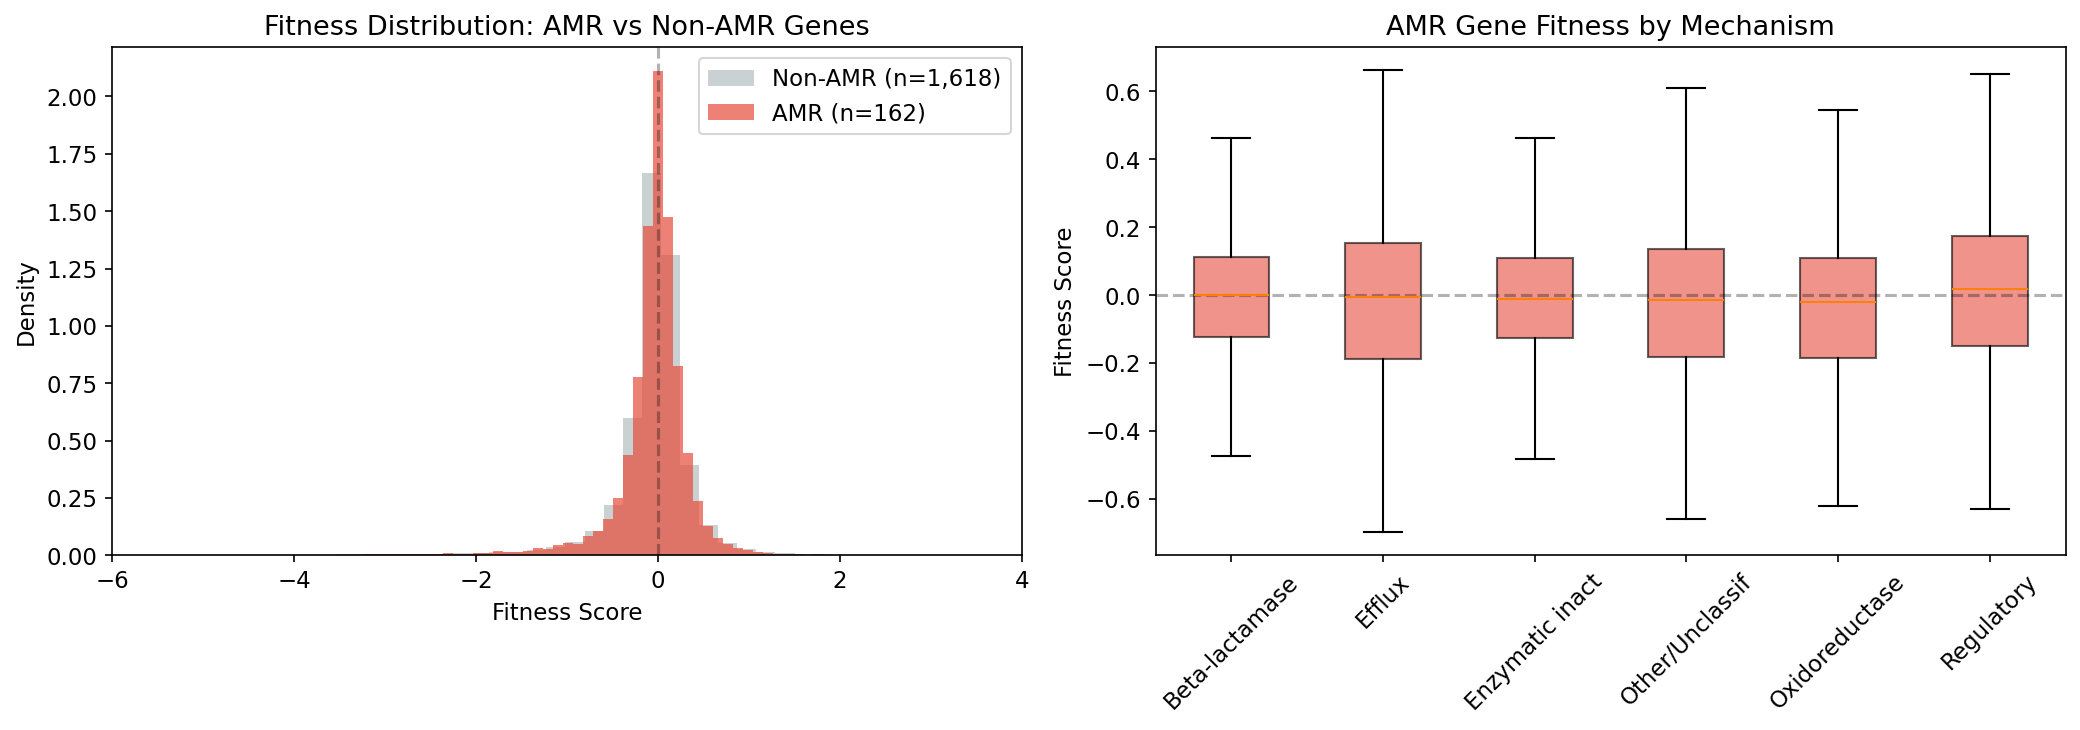
Using the DIAMOND-based FB-pangenome link table (177,863 links at 100% sequence identity), we identified 178 AMR genes across 37 Fitness Browser organisms, yielding 29,386 fitness measurements. Surprisingly, AMR genes show slightly less fitness cost than the non-AMR baseline (median fitness -0.007 vs -0.012, Mann-Whitney p=3.7e-6). Beta-lactamases are nearly neutral (median -0.001). Singleton AMR genes are costliest (median -0.019). This suggests that the AMR genes present in these predominantly environmental FB organisms are well-integrated intrinsic resistance genes, not recently acquired mobile elements. The 100% identity threshold is conservative — it avoids paralog confusion but may undercount fitness effects for closely related gene variants (e.g., alleles differing by a single synonymous substitution). Furthermore, the Fitness Browser organisms are predominantly environmental isolates where intrinsic resistance predominates; the fitness cost of recently acquired mobile resistance elements in clinical pathogens may differ substantially.
(Notebook: 06_fitness_crossref.ipynb)
Results
AMR Census
The bakta_amr table contains 83,008 AMRFinderPlus hits on gene cluster representatives, covering 82,908 distinct clusters across 14,723 species (53.2% of the 27,690 pangenome species). Detection methods: HMM (51.5%), BLASTP (22.7%), EXACTP (13.0%), PARTIALP (9.7%), ALLELEP (3.0%). The 83K hits span 1,939 distinct AMR gene families and 2,079 AMR products.
Mechanism Classification
| Mechanism | Count | % | Core % |
|---|---|---|---|
| Other/Unclassified | 18,448 | 22.2% | 24.0% |
| Enzymatic inactivation | 15,755 | 19.0% | 28.2% |
| Efflux | 14,338 | 17.3% | 30.9% |
| Beta-lactamase | 12,824 | 15.4% | 54.9% |
| Target modification | 6,955 | 8.4% | 19.6% |
| Oxidoreductase | 6,852 | 8.3% | 15.4% |
| Cell wall modification | 4,964 | 6.0% | 45.2% |
| Regulatory | 2,848 | 3.4% | 6.5% |
Mechanism classification uses keyword matching against AMRFinderPlus product descriptions (e.g., “beta-lactamase”, “efflux”, “acetyltransferase”), not the CARD Antibiotic Resistance Ontology (ARO). The 22.2% “Other/Unclassified” category includes genes with product descriptions that do not match any keyword set (e.g., ribosomal protection proteins with non-standard names, novel resistance mechanisms). Future work could reduce this fraction by mapping bakta_db_xrefs cross-references to CARD ARO terms, which would provide a systematic, ontology-based classification.
Dominant AMR Gene Families
The top 5 AMR gene families are: bla (beta-lactamases, 6,115 hits), merA (mercury reductase, 4,506), arsD (arsenic metallochaperone, 2,611), merP (mercury binding protein, 2,222), and vanR (vancomycin response regulator, 1,929). Heavy metal resistance genes (mer, ars families) are prominent — reflecting the broad definition of AMR in the NCBI Reference Gene Catalog, which includes stress response genes.
Taxonomic Distribution
| Phylum | Species with AMR | Total AMR | Mean AMR/sp | % Species with AMR |
|---|---|---|---|---|
| Pseudomonadota | 4,992 | 42,904 | 8.6 | 67.0% |
| Bacillota | 1,401 | 12,614 | 9.0 | 65.3% |
| Actinomycetota | 2,036 | 9,027 | 4.4 | 64.2% |
| Bacillota_A | 2,254 | 8,776 | 3.9 | 57.5% |
| Bacteroidota | 1,835 | 5,458 | 3.0 | 50.6% |
Annotation Depth
93.0% of AMR clusters have both Bakta product annotations and eggNOG hits (2 annotation sources). The remaining 7.0% have Bakta annotations only. Notably, zero AMR clusters have Pfam domain hits in the bakta_pfam_domains table — AMRFinderPlus and Pfam HMM scans appear to target non-overlapping sequence space for these gene families. The sparsely-annotated (1-source) AMR clusters are enriched for singletons (55.4% vs 34.6%).
Interpretation
The Intrinsic-Acquired Dichotomy
The central finding of this analysis is that AMR genes partition into two distinct populations with different evolutionary dynamics:
-
Intrinsic resistance genes (beta-lactamases like ampC, efflux systems like emhABC, rifampin monooxygenases like rox) are core genome residents. They are vertically inherited, present in >95% of genomes within a species, and impose negligible fitness costs. These represent the species’ baseline defensive repertoire.
-
Acquired resistance genes (blaTEM, tet cassettes, aminoglycoside modifying enzymes like ant(2”)-Ia) are fully accessory — often 0% core, appearing as singletons or in a minority of genomes. These are horizontally transferred elements that spread under antibiotic selection pressure.
This dichotomy is not new conceptually (Larsson & Flach, 2022; Feldgarden et al., 2021), but our analysis quantifies it for the first time across 14,723 species simultaneously, showing that the OR=0.49 depletion of AMR from the core genome is a universal bacterial pattern, not specific to individual pathogens.
Environmental Context Matters
The 2.7x higher AMR density in clinical vs environmental species, combined with the lower core fraction of clinical AMR (30.8% vs 58.1%), reveals a clear ecological gradient: environments with antibiotic exposure (hospitals, animal husbandry) select for the accumulation of acquired resistance, while environmental species maintain primarily intrinsic defenses.
The AlphaEarth embedding result (rho=0.466 between environmental diversity and AMR count) suggests that niche breadth enables resistance accumulation — species that encounter diverse environments (and diverse microbial communities) have more opportunities to acquire resistance genes via horizontal transfer. This aligns with the “environmental reservoir” hypothesis of AMR evolution (Larsson & Flach, 2022).
Heavy Metal Resistance Is a Major AMR Component
Mercury resistance genes (merA, merP, merC, merE, merF, merR, merD, merB, merT) collectively account for ~15,000 hits — 18% of all AMR annotations. Arsenic resistance (arsD, arsN1, arsN2, arsC) adds another ~6,000. This reflects AMRFinderPlus’s broad scope (the Reference Gene Catalog includes stress response genes), but it also highlights that heavy metal and antibiotic resistance are genomically intertwined, often co-located on mobile elements (as reflected in the COG P enrichment).
Literature Context
- The accessory genome enrichment of AMR genes agrees with pangenome studies of individual pathogens: Neisseria gonorrhoeae (Sanchez-Buso et al., 2022), Salmonella (multiple studies), and Corynebacterium striatum (Costa et al., 2023) all report AMR in the accessory genome. Our analysis confirms this as a universal pattern across 27K species.
- The clinical vs environmental AMR difference aligns with Hua et al. (2020), who compared US clinical and environmental isolates and found higher resistance frequencies in clinical settings. Our data extends this to 7,838 species with text-classified isolation sources.
- The fitness neutrality of intrinsic AMR genes is consistent with our prior finding that core genes are paradoxically more burdensome overall (core_gene_tradeoffs project) — the AMR subset of core genes appears to be an exception, imposing even less cost than non-AMR core genes.
Novel Contribution
This is the first analysis to:
- Quantify AMR conservation across 14,723 species simultaneously using uniform annotation (Bakta + AMRFinderPlus)
- Demonstrate the intrinsic-acquired conservation dichotomy at pan-bacterial scale (OR=0.49, mechanism-specific)
- Link environmental diversity (AlphaEarth embeddings) to AMR accumulation (rho=0.466)
- Show that clinical AMR is structurally different from environmental AMR (more acquired, less core)
Limitations
- Sampling bias: Genome databases over-represent clinical pathogens, inflating AMR counts for human-associated species
- AMRFinderPlus scope: Includes stress response genes (mercury, arsenic) alongside classical antibiotic resistance — the 83K hits are not all “antibiotic” resistance per se
- AlphaEarth coverage: Only 28% of genomes have embeddings, biased toward genomes with geographic metadata
- Fitness Browser coverage: Only 37/48 FB organisms had AMR genes, and these are predominantly environmental strains — the fitness analysis doesn’t capture the cost of recently acquired mobile resistance in pathogens
- Mechanism classification: The keyword-based mechanism classification leaves 22% as “Other/Unclassified” — a more systematic approach using CARD ontology would improve this
- Singleton inflation: Some singleton AMR clusters may reflect annotation artifacts rather than true species-specific resistance genes
- Multiple testing: The six hypotheses involve many individual tests (per-mechanism binomial tests, per-phylum correlations, per-environment comparisons). Formal Bonferroni or FDR correction was not applied because the primary test p-values are extreme (many < 1e-100) and correction would not change any conclusion. The per-gene and per-phylum tests are exploratory and should be interpreted as hypothesis-generating
- FB-pangenome identity threshold: The 100% DIAMOND identity threshold for FB-pangenome linking is conservative; closely related allelic variants may be missed, potentially undercounting AMR gene fitness effects
Data
Sources
| Collection | Tables Used | Purpose |
|---|---|---|
kbase_ke_pangenome | bakta_amr, gene_cluster, bakta_annotations, eggnog_mapper_annotations, bakta_pfam_domains, pangenome, genome, gtdb_taxonomy_r214v1, ncbi_env, alphaearth_embeddings_all_years | AMR annotations, conservation flags, functional context, taxonomy, environment |
kescience_fitnessbrowser | organism, gene, genefitness | Fitness effects of AMR genes |
Generated Data
| File | Rows | Description |
|---|---|---|
data/amr_census.csv | 83,008 | Full AMR table with conservation, mechanism, taxonomy, annotation depth |
data/amr_species_summary.csv | 14,723 | Per-species AMR counts, pangenome stats, taxonomy |
data/amr_conservation_by_gene.csv | 1,939 | Per-AMR-gene family conservation statistics |
data/amr_conservation_by_species.csv | 14,723 | Per-species AMR core fraction vs species baseline |
data/amr_cog_enrichment.csv | 21 | COG category enrichment (AMR vs pangenome baseline) |
data/amr_by_environment.csv | 7,838 | Species AMR data with environment classification |
data/amr_phylum_summary.csv | 94 | Phylum-level AMR aggregation |
data/amr_by_family.csv | 1,209 | Family-level AMR aggregation |
data/amr_by_genus.csv | 4,257 | Genus-level AMR aggregation |
data/amr_fitness.csv | 29,386 | Fitness measurements for 162 AMR genes in 36 FB organisms |
Supporting Evidence
Notebooks
| Notebook | Purpose |
|---|---|
01_amr_census.ipynb | Full AMR table scan, conservation analysis, mechanism classification, species density, taxonomy, openness, functional annotation depth |
02_conservation_patterns.ipynb | Per-species paired conservation test, per-gene family analysis, mechanism-level binomial tests |
03_phylogenetic_distribution.ipynb | Taxonomic hierarchy at all ranks, hotspot families, within-phylum openness correlations |
04_functional_context.ipynb | COG enrichment vs pangenome baseline, annotation depth tiers |
05_environmental_distribution.ipynb | NCBI isolation_source classification, AlphaEarth embedding diversity analysis |
06_fitness_crossref.ipynb | DIAMOND-based FB-pangenome linking, AMR fitness effects vs baseline |
07_synthesis.ipynb | Multi-panel publication figure |
Figures
| Figure | Description |
|---|---|
amr_conservation_vs_baseline.png | AMR conservation class vs pangenome baseline |
amr_conservation_per_species.png | Per-species AMR core fraction scatter and enrichment distribution |
amr_mechanism_conservation.png | Stacked bar: conservation by AMR mechanism |
amr_gene_families_core_fraction.png | Top 30 AMR gene families ranked by % core |
amr_hit_quality_distributions.png | AMRFinderPlus identity and coverage distributions |
amr_species_density_distribution.png | AMR clusters per species distribution |
amr_phylum_distribution.png | Phylum-level AMR prevalence and density |
amr_vs_pangenome_structure.png | AMR count vs openness, pangenome size, genome count |
amr_hotspot_families.png | Top 20 AMR hotspot families |
amr_mechanism_by_phylum.png | Mechanism composition by phylum |
amr_openness_by_phylum.png | Faceted scatter: AMR vs openness by phylum |
amr_cog_enrichment.png | COG category enrichment in AMR genes |
amr_by_environment.png | AMR count by isolation environment |
amr_alphaearth_diversity.png | AlphaEarth environmental diversity vs AMR |
amr_fitness_distribution.png | AMR vs non-AMR fitness distribution and fitness by mechanism |
fig1_amr_overview.png | 4-panel overview figure |
Future Directions
- NMDC/MGnify integration: Map AMR gene prevalence in environmental metagenome communities — are the accessory AMR genes we see in isolate genomes also prevalent in community DNA?
- Temporal analysis: Use phylogenetic tree distances to estimate AMR gene gain/loss rates — are acquired resistance genes being gained faster than lost?
- Co-localization analysis: Are AMR genes clustered in genomic islands? Do they co-localize with mobile element markers (IS elements, integrons)?
- CARD ontology mapping: Replace keyword-based mechanism classification with systematic CARD Antibiotic Resistance Ontology (ARO) mapping to reduce the 22% “Other/Unclassified” category
- Structural analysis: Cross-reference AMR proteins with AlphaFold/PDB structures to identify novel resistance folds
- Expanded fitness analysis: Use the full FB-pangenome link table to test fitness costs specifically under antibiotic stress conditions, not just standard lab media
References
- Feldgarden M, Brover V, Gonzalez-Escalona N, et al. (2021). “AMRFinderPlus and the Reference Gene Catalog facilitate examination of the genomic links among antimicrobial resistance, stress response, and virulence.” Scientific Reports 11:12728. PMID: 34135355
- Larsson DGJ, Flach CF (2022). “Antibiotic resistance in the environment.” Nature Reviews Microbiology 20:257-269. PMID: 34737424
- Hua X, Liang Q, Deng M, et al. (2020). “Comparison of Antimicrobial Resistance Detected in Environmental and Clinical Isolates from Historical Data for the US.” BioMed Research International 2020:4254530. PMID: 32351993
- Schwengers O, Jelonek L, Diber MA, Grüning BA, (2021). “Bakta: rapid and standardized annotation of bacterial genomes via alignment-free sequence identification.” Microbial Genomics 7(11):000685. PMID: 34739369
- Parks DH, Chuvochina M, Rinke C, et al. (2022). “GTDB: an ongoing census of bacterial and archaeal diversity through a phylogenetically consistent, rank normalized and complete genome-based taxonomy.” Nucleic Acids Research 50:D199-D207. PMID: 34520557
- Price MN, Wetmore KM, Waters RJ, et al. (2018). “Mutant phenotypes for thousands of bacterial genes of unknown function.” Nature 557:503-509. PMID: 29769716
- Arkin AP, Cottingham RW, Henry CS, et al. (2018). “KBase: The United States Department of Energy Systems Biology Knowledgebase.” Nature Biotechnology 36:566-569. PMID: 29979655