The environment-embedding-geography concept asks whether environmental variables such as soil metal concentrations explain microbial gene content and ecological breadth. Two metal-focused projects report statistically significant associations. Each also documents caveats that leave open whether metals themselves drive the signal. In the soil study these caveats are conditioning, co-varying metals and spatial matching. In MicrobeAtlas they are sensitivity to a prevalence filter and a null habitat-specific test. This matters because the concept page treats environment–genome coupling as a key inference. If attribution is weaker than the headline statistics imply, metal-driven functional adaptation would be overstated across the corpus.
Evidence Sides
Side A: strong conditional multivariate association. Distance-based redundancy analysis (db-RDA) partitions multivariate community variance among predictors. R² is the fraction of variance the predictors explain. In the conditional form used here, the denominator is the variance remaining after project effects are conditioned out. The p-value is the probability of an association at least this strong if none existed. In the soil-metal study, metals gave a conditional db-RDA R²=0.799 with p=0.005 1. In the MicrobeAtlas analysis, the number of distinct metal types resisted per genus was associated with ecological breadth. This association had a regression coefficient β=+0.021 and p=1.5×10^-4 2.
Side B: uncertain attribution and fragile robustness. The unconditional metal-only R² for the soil study was not reported. The 0.799 figure is therefore a conditional quantity, not the total variance explained by metals 1. Chromium, copper, lead and zinc co-vary, so individual metal effects cannot be separated cleanly 1. The 60% discovery rate may be inflated by correlated tests 1. Linking samples to genomes by proximity within 10 km does not guarantee co-location 1. In MicrobeAtlas, a strict prevalence filter gave p=0.092, so the association lost significance 2. Groundwater-specific fold enrichment was null (rho=+0.042, p=0.242) 2.
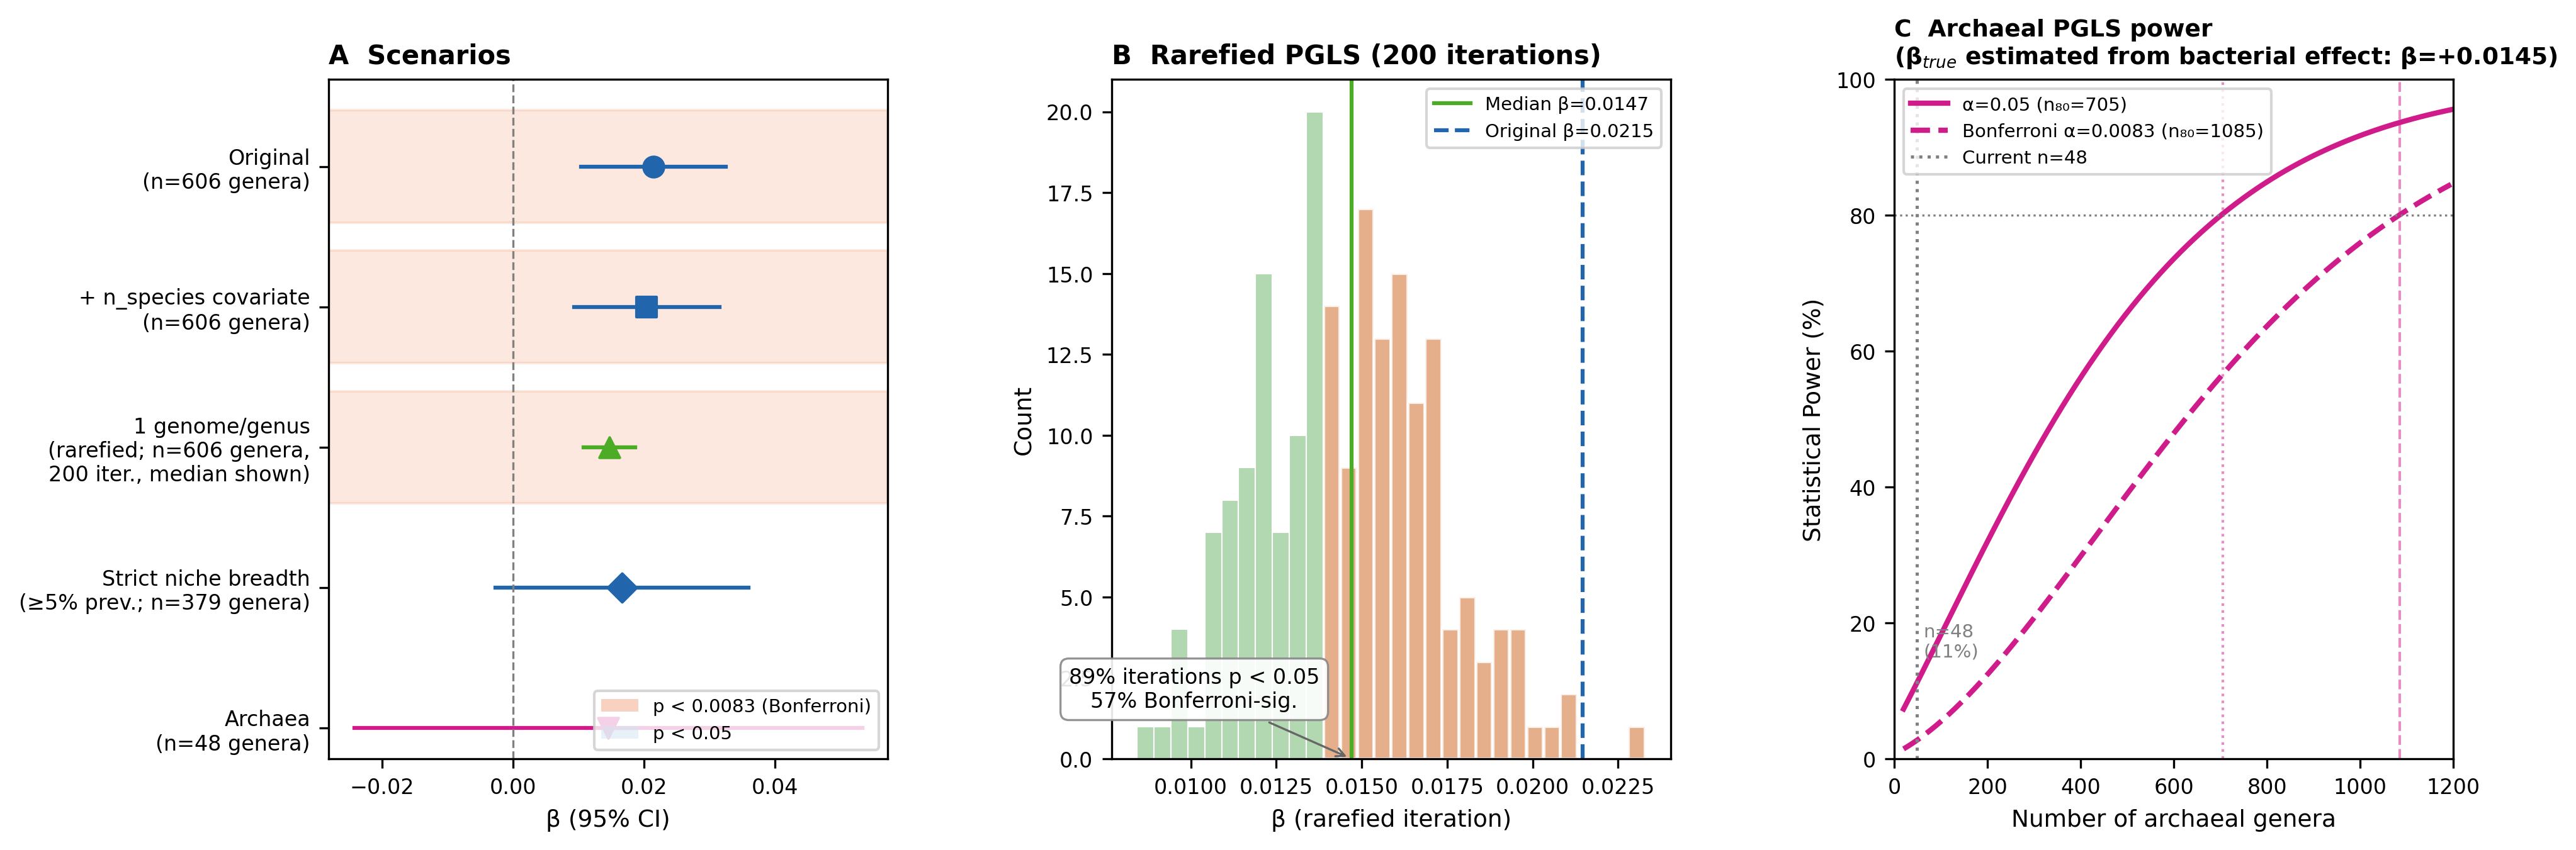 Robustness summary: Panel A — β across 5 analysis scenarios; Panel B — rarefied β distribution (200 iterations); Panel C — archaeal power curve. From microbeatlas_metal_ecology.
Possible Reconciliations
- Hypothesis: Metals carry real explanatory power, but the conditional R² overstates it relative to total variance. Both sides would then be correct about different denominators.
- Hypothesis: The co-varying metals stand in for a shared contamination or industrial-soil gradient. The association would be genuine while the attribution to specific metals is not.
- Hypothesis: The MicrobeAtlas signal depends on rare, low-prevalence occurrences. It may reflect detection breadth rather than true ecological breadth, which would explain why it weakens under strict prevalence.
- Hypothesis: The metal effects are habitat-specific. A global association could then coexist with a null groundwater-specific result.
Resolving Work
- Soil-metal community data with db-RDA: Report the unconditional metal-only R² next to the conditional value. This answers how much of the total community functional variance metals explain.
- Soil-metal concentrations with partial-correlation or joint models: Model chromium, copper, lead and zinc jointly. This tests whether any single metal retains an independent association once the others are controlled.
- Discovery tests with dependence-aware error control: Re-estimate the 60% discovery rate using permutation-based or dependence-robust false discovery rate (FDR) control. FDR is the expected share of false positives among reported hits. This tests whether the rate survives correlated tests.
- Spatial matching sensitivity: Rerun the analyses with tighter sample–genome matching distances below 10 km to test how sensitive the associations are to matching distance. Only exactly co-located metagenomes would test whether associations persist when co-location is guaranteed.
- MicrobeAtlas prevalence and habitat stratification: Sweep the prevalence filter and fit models within each habitat. This identifies the prevalence threshold and the habitats where the β association holds or vanishes.